StochAlgo Forex Trading Strategy

This post contains affiliate links. If you use these links to register at one of the trusted brokers, I may earn a commission. This helps me to create more free content for you. Thanks!
StochAlgo is, in its essence, one of the simplest forex strategies that I have developed, but on the other hand, it provides surprisingly positive and stable expectancy. The main idea behind this strategy is to look for potential trade opportunities right at the start of each hour when it can be expected that an overall market trading activity is considerably increased. A substantial number of strategies process data from the H1 chart/timeframe, so the trade decision would not be processed until the whole hourly interval is completed – that means a lot of the strategies are waiting until the first tick (price data) from the new hour is available. Resulting from the higher trading activity, a significant movement in one direction may also be expected.
The main task while developing this strategy was to look for a common behavior across all the FX pairs to see if there was some universal market inefficiency at that time that could be parameterized, coded, optimized, and then exploited. My overall trading philosophy is primarily to look for oversold/overbought market areas and speculate on the potential trend reversal. This strategy is no different in its underlying ideas.
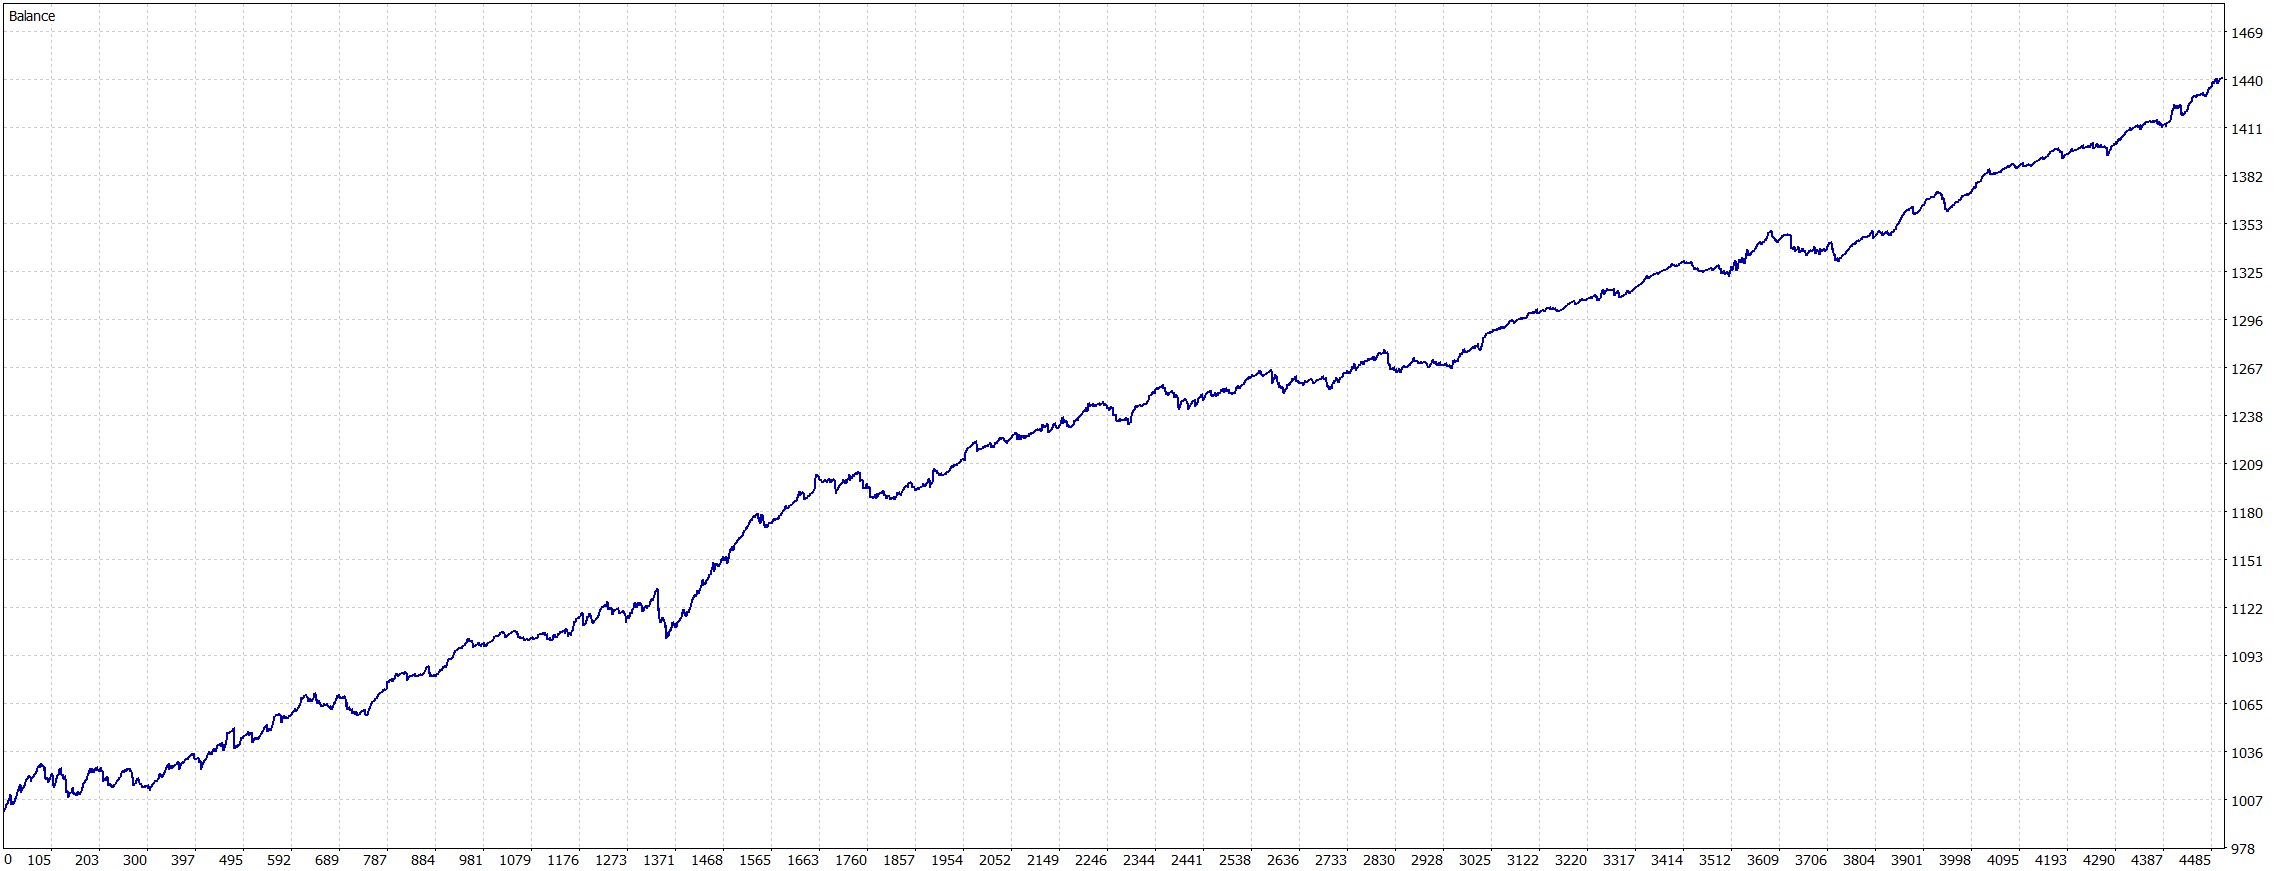
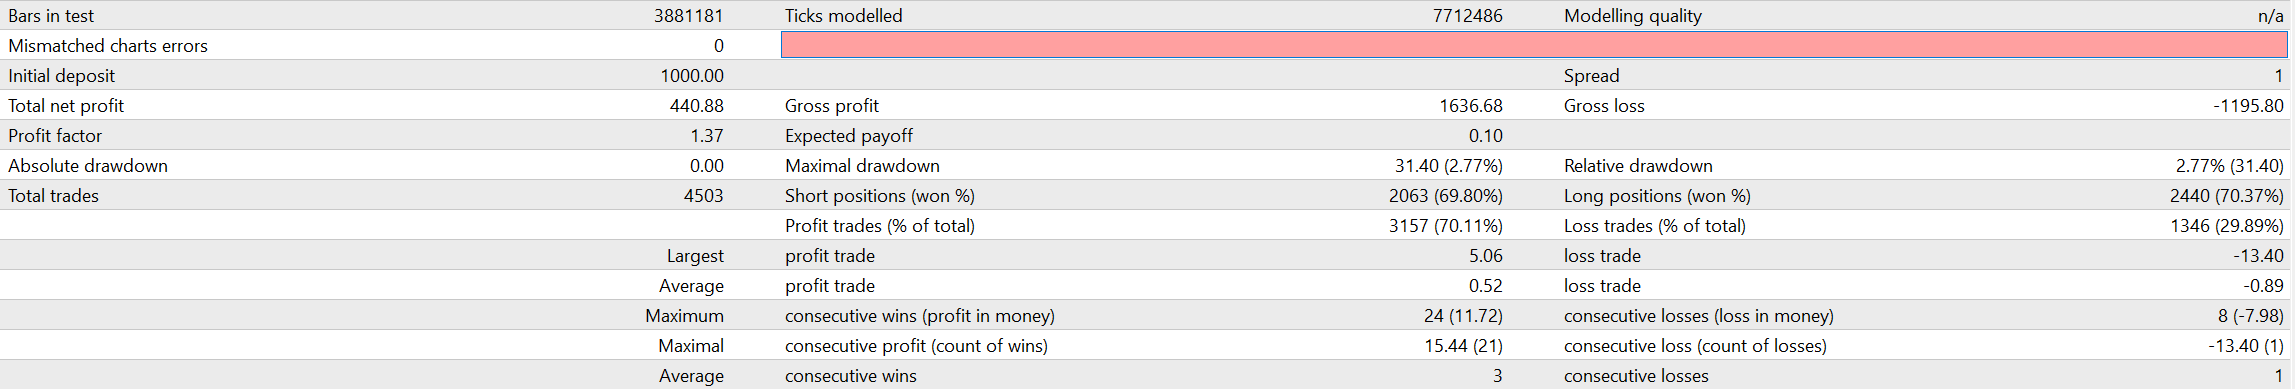
At first, I developed a very simple version of the strategy to test if the idea had any potential positive expectancy, and I have to say, I was pleasantly surprised. Here you can see some of the first outcomes the strategy has produced in the backtest:
After seeing these results, I decided to work on the strategy further. I have tested numerous complementary ideas, indicators, and tools. After lots of trials and errors, I was able to confidently say that the strategy is ready to be optimized and hopefully put into the real environment. If you want to learn how exactly the strategy works, I elaborated more on the details down here.
Strategy Logic
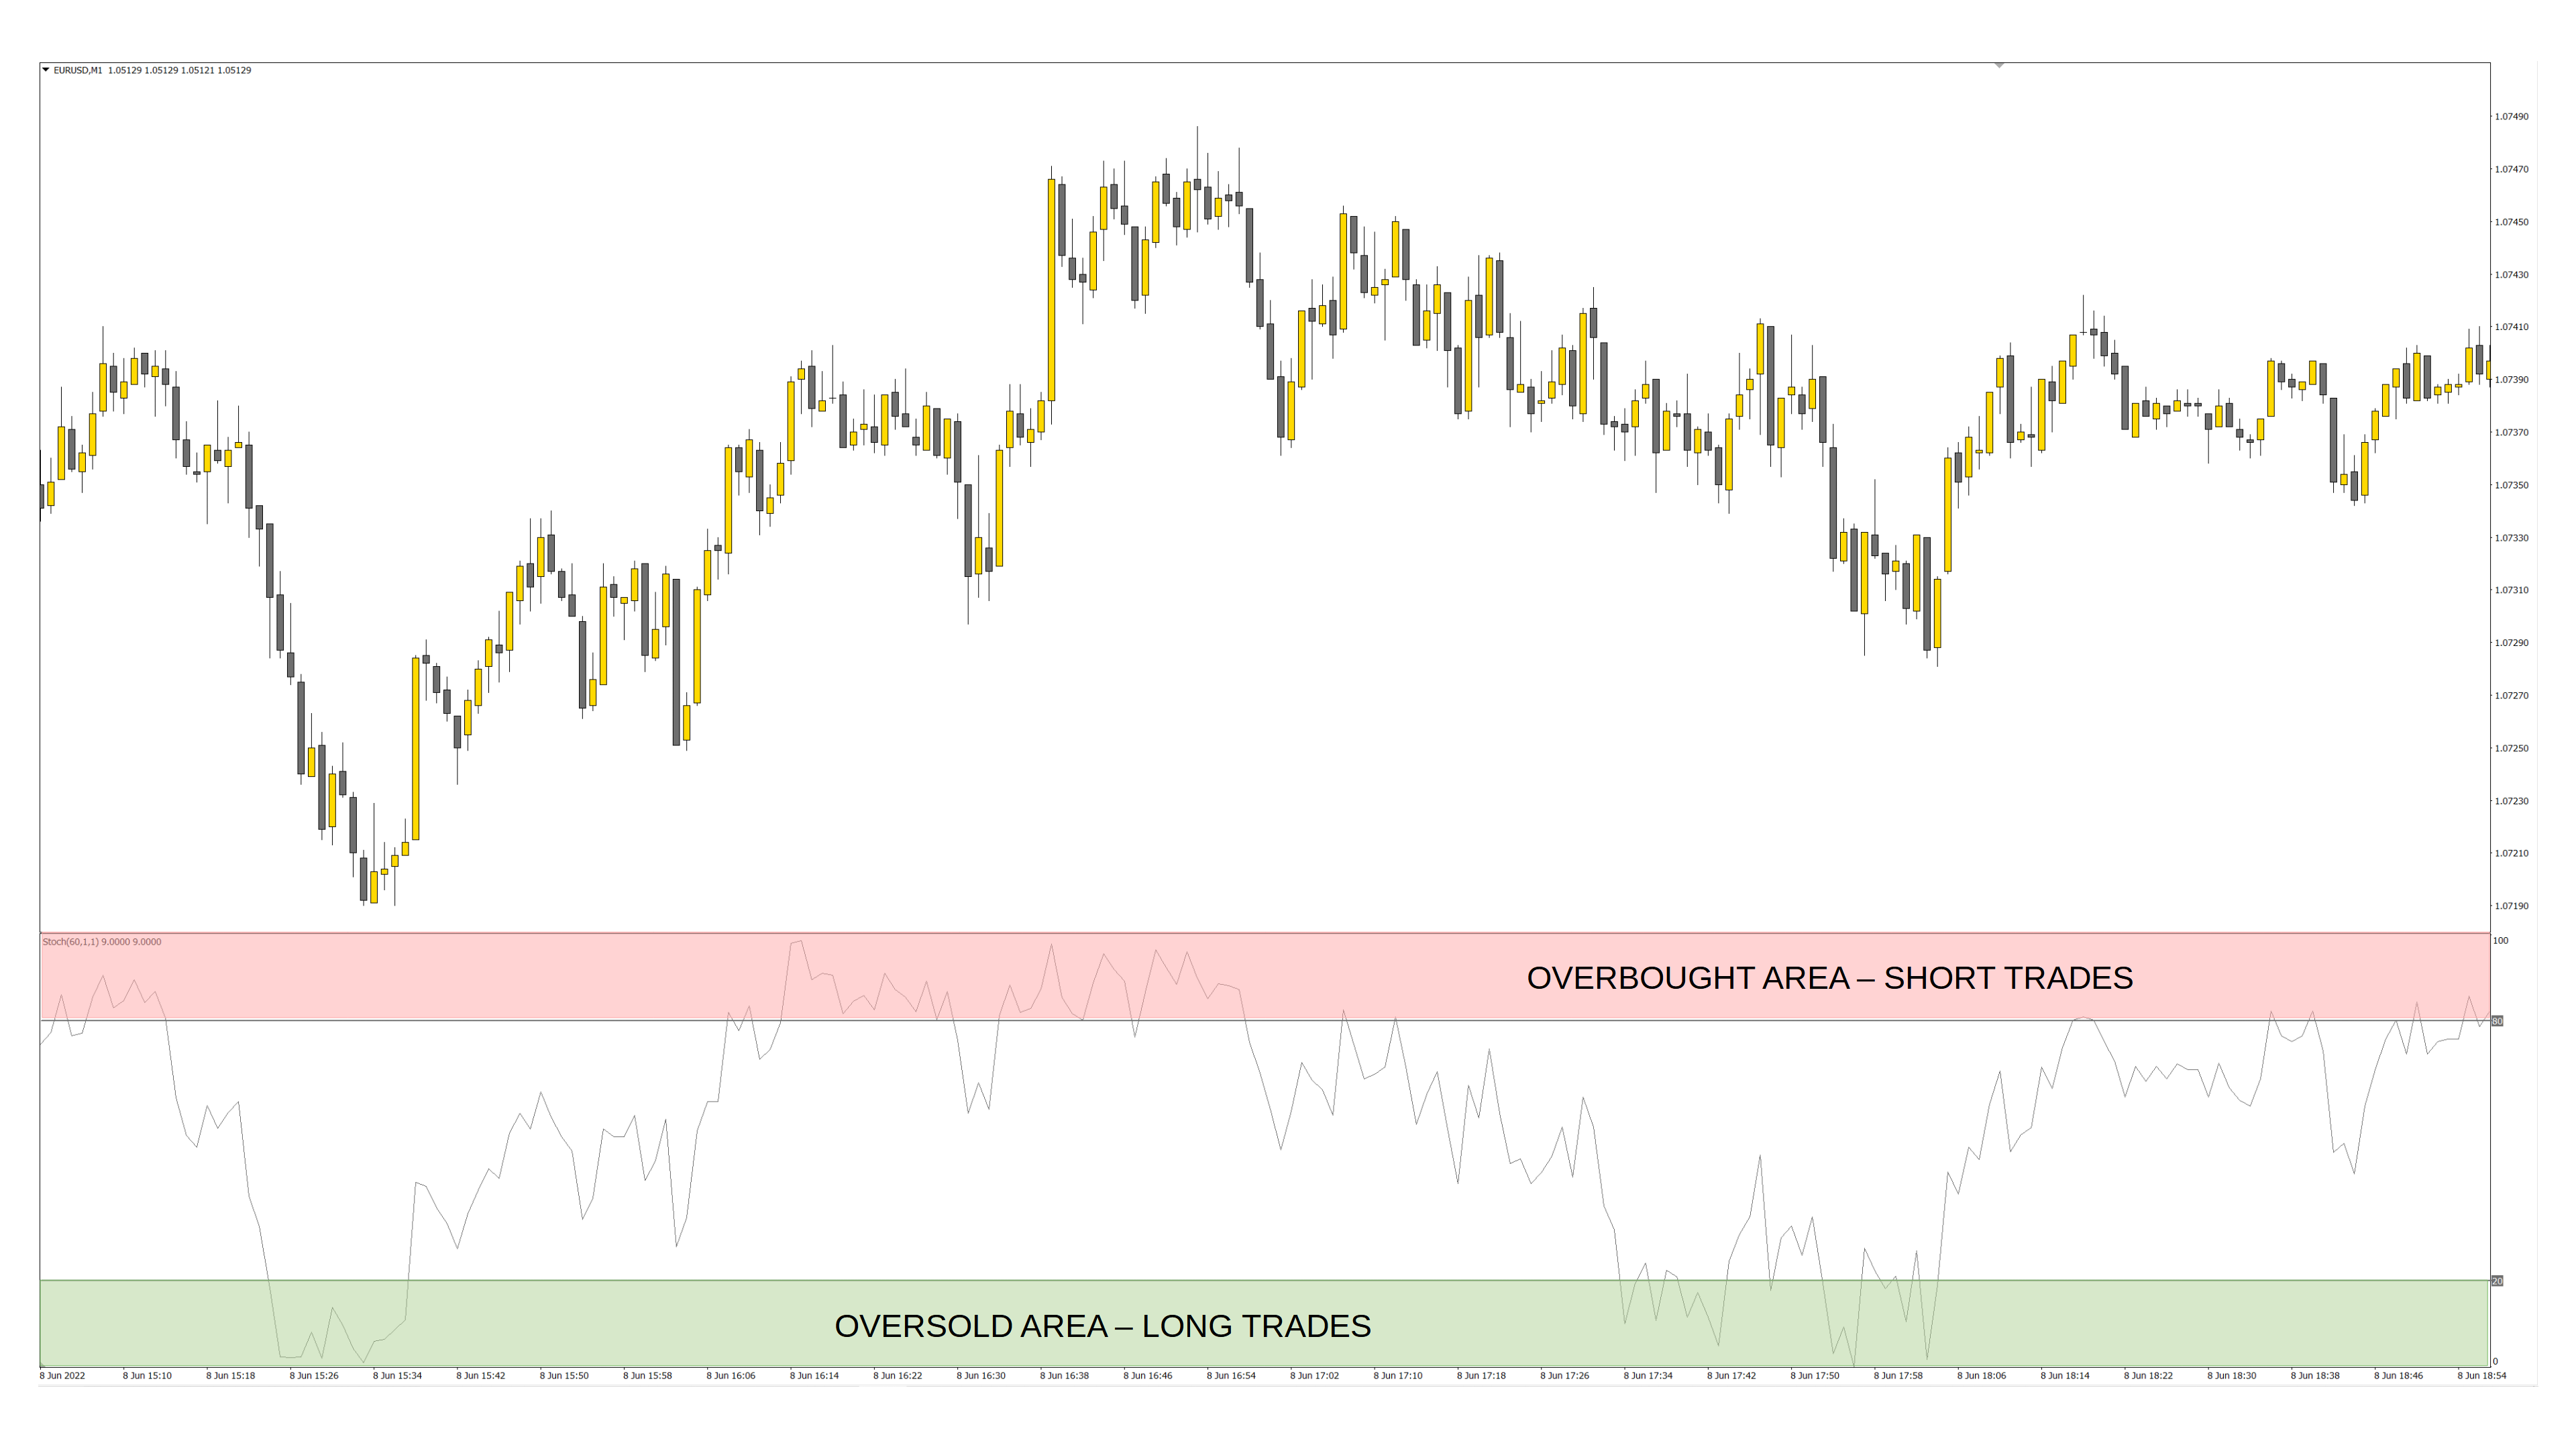
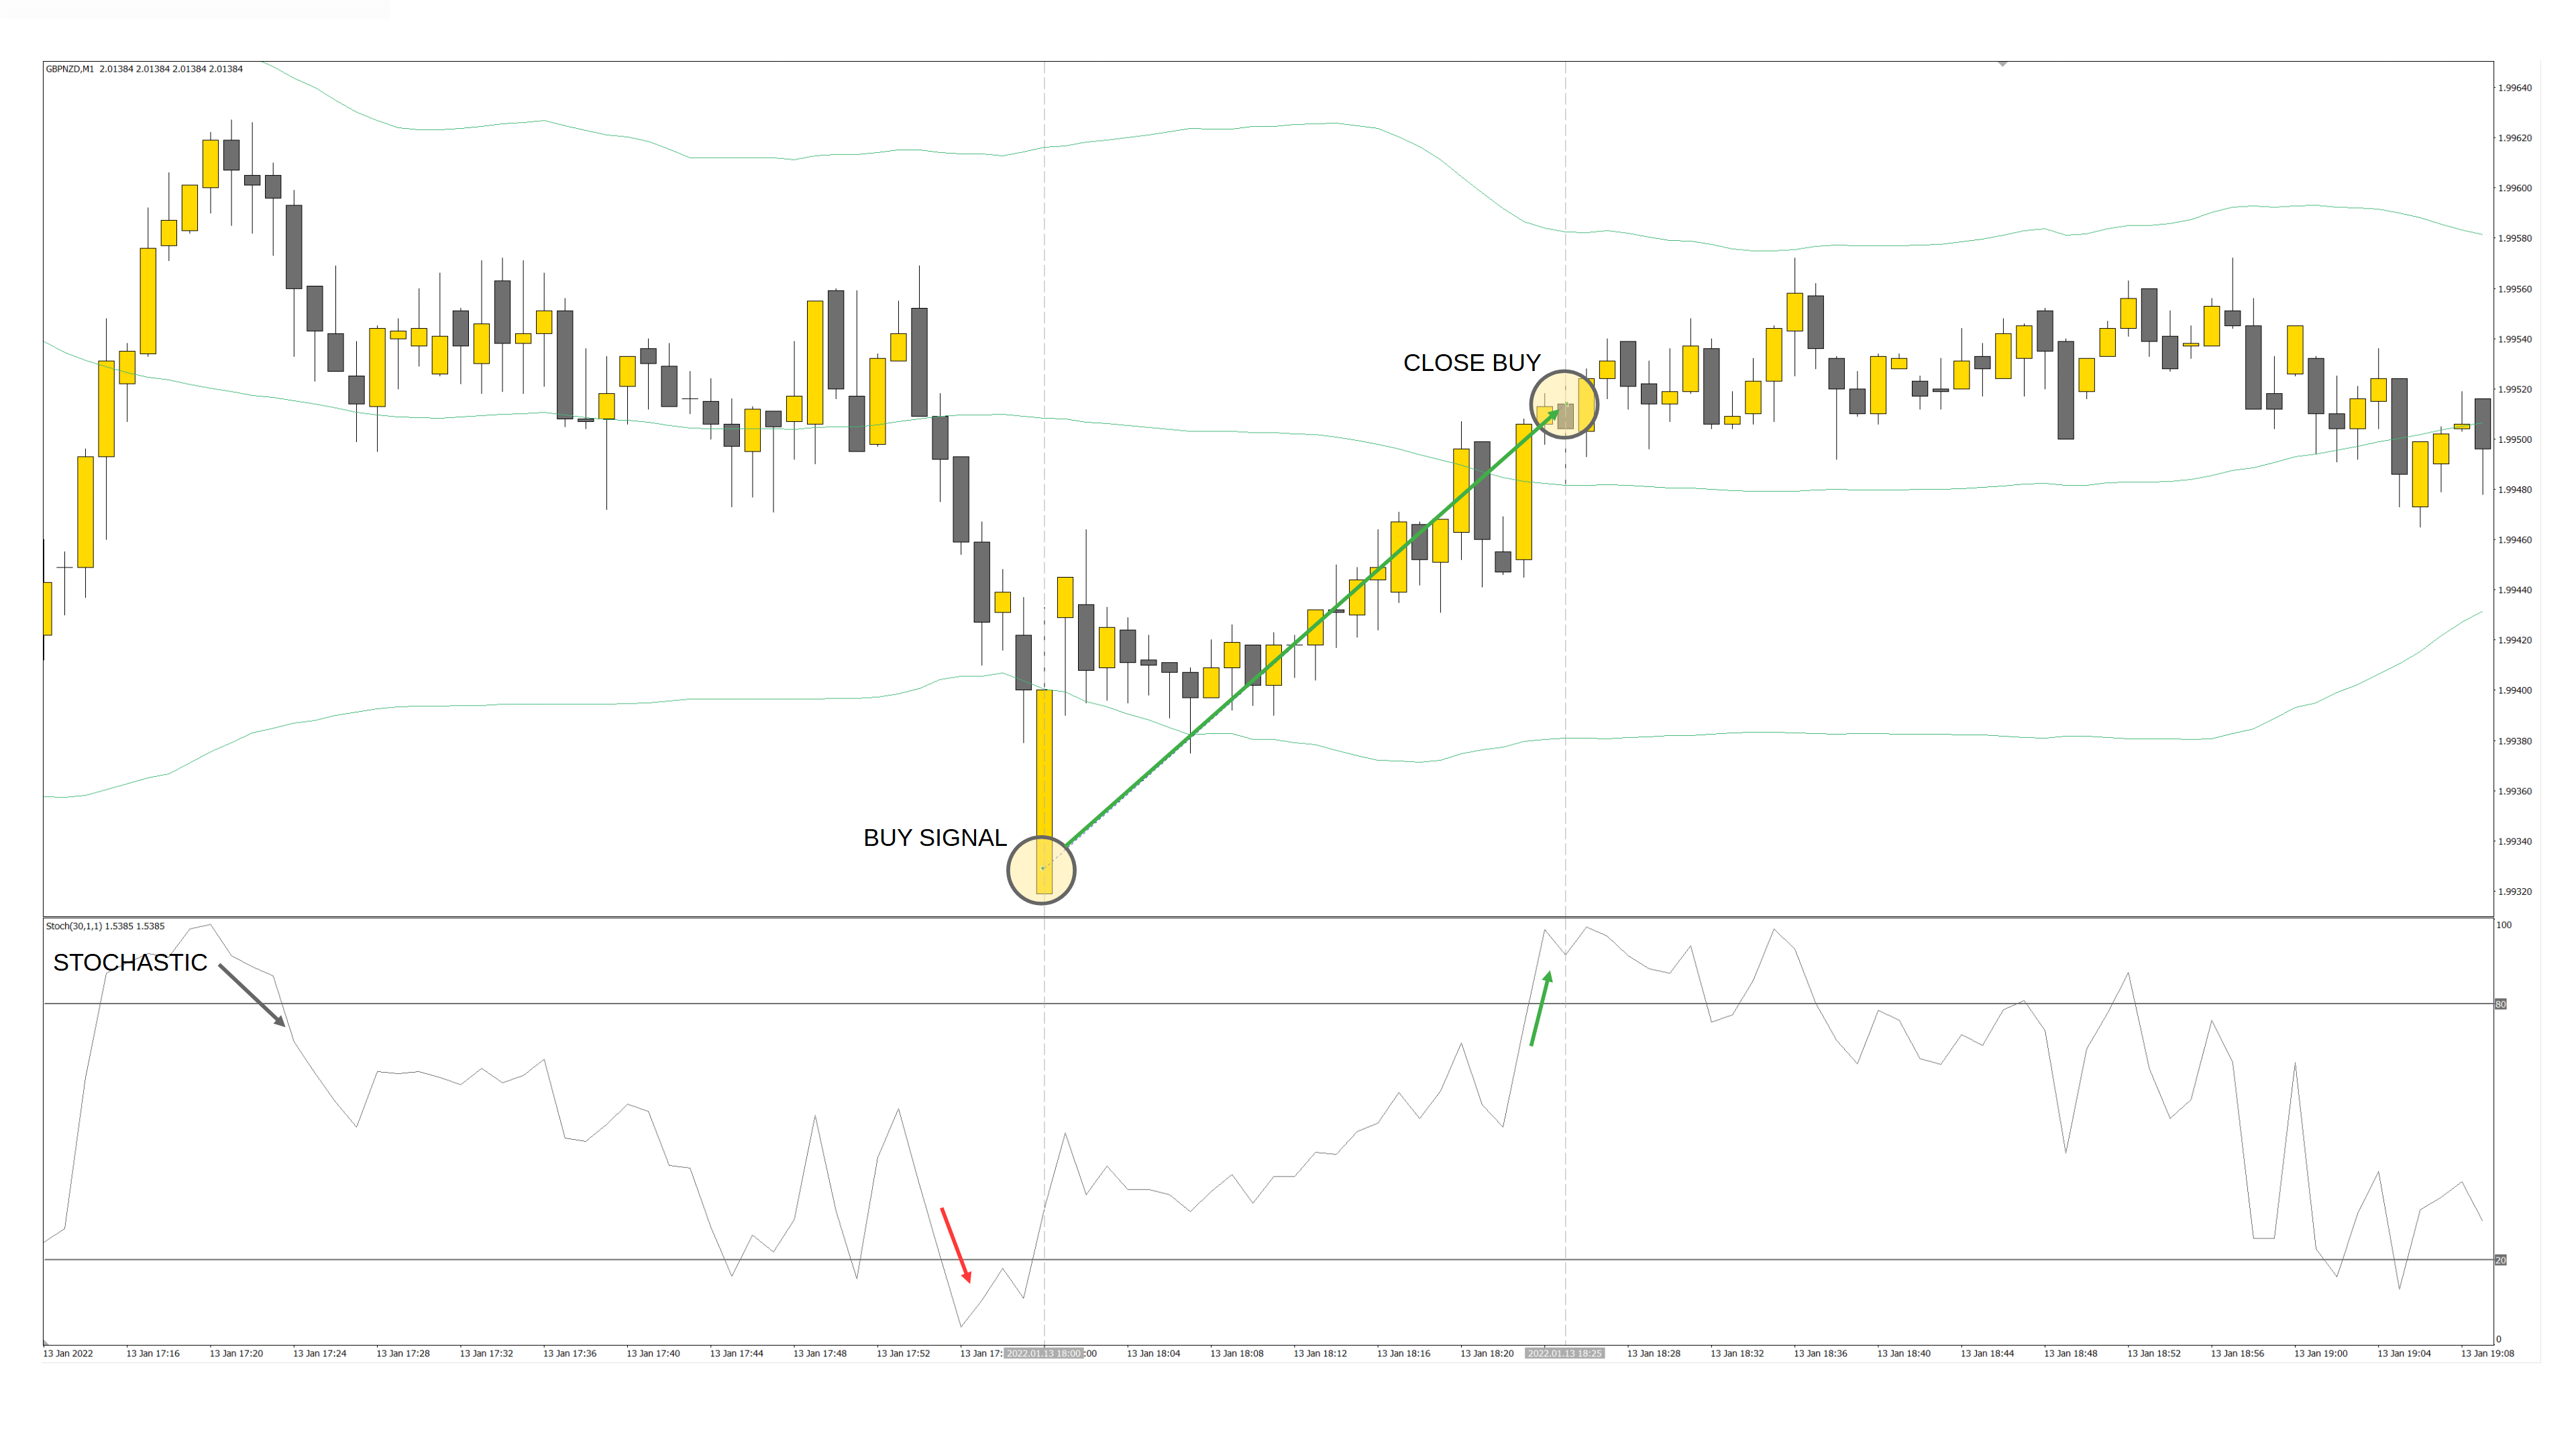
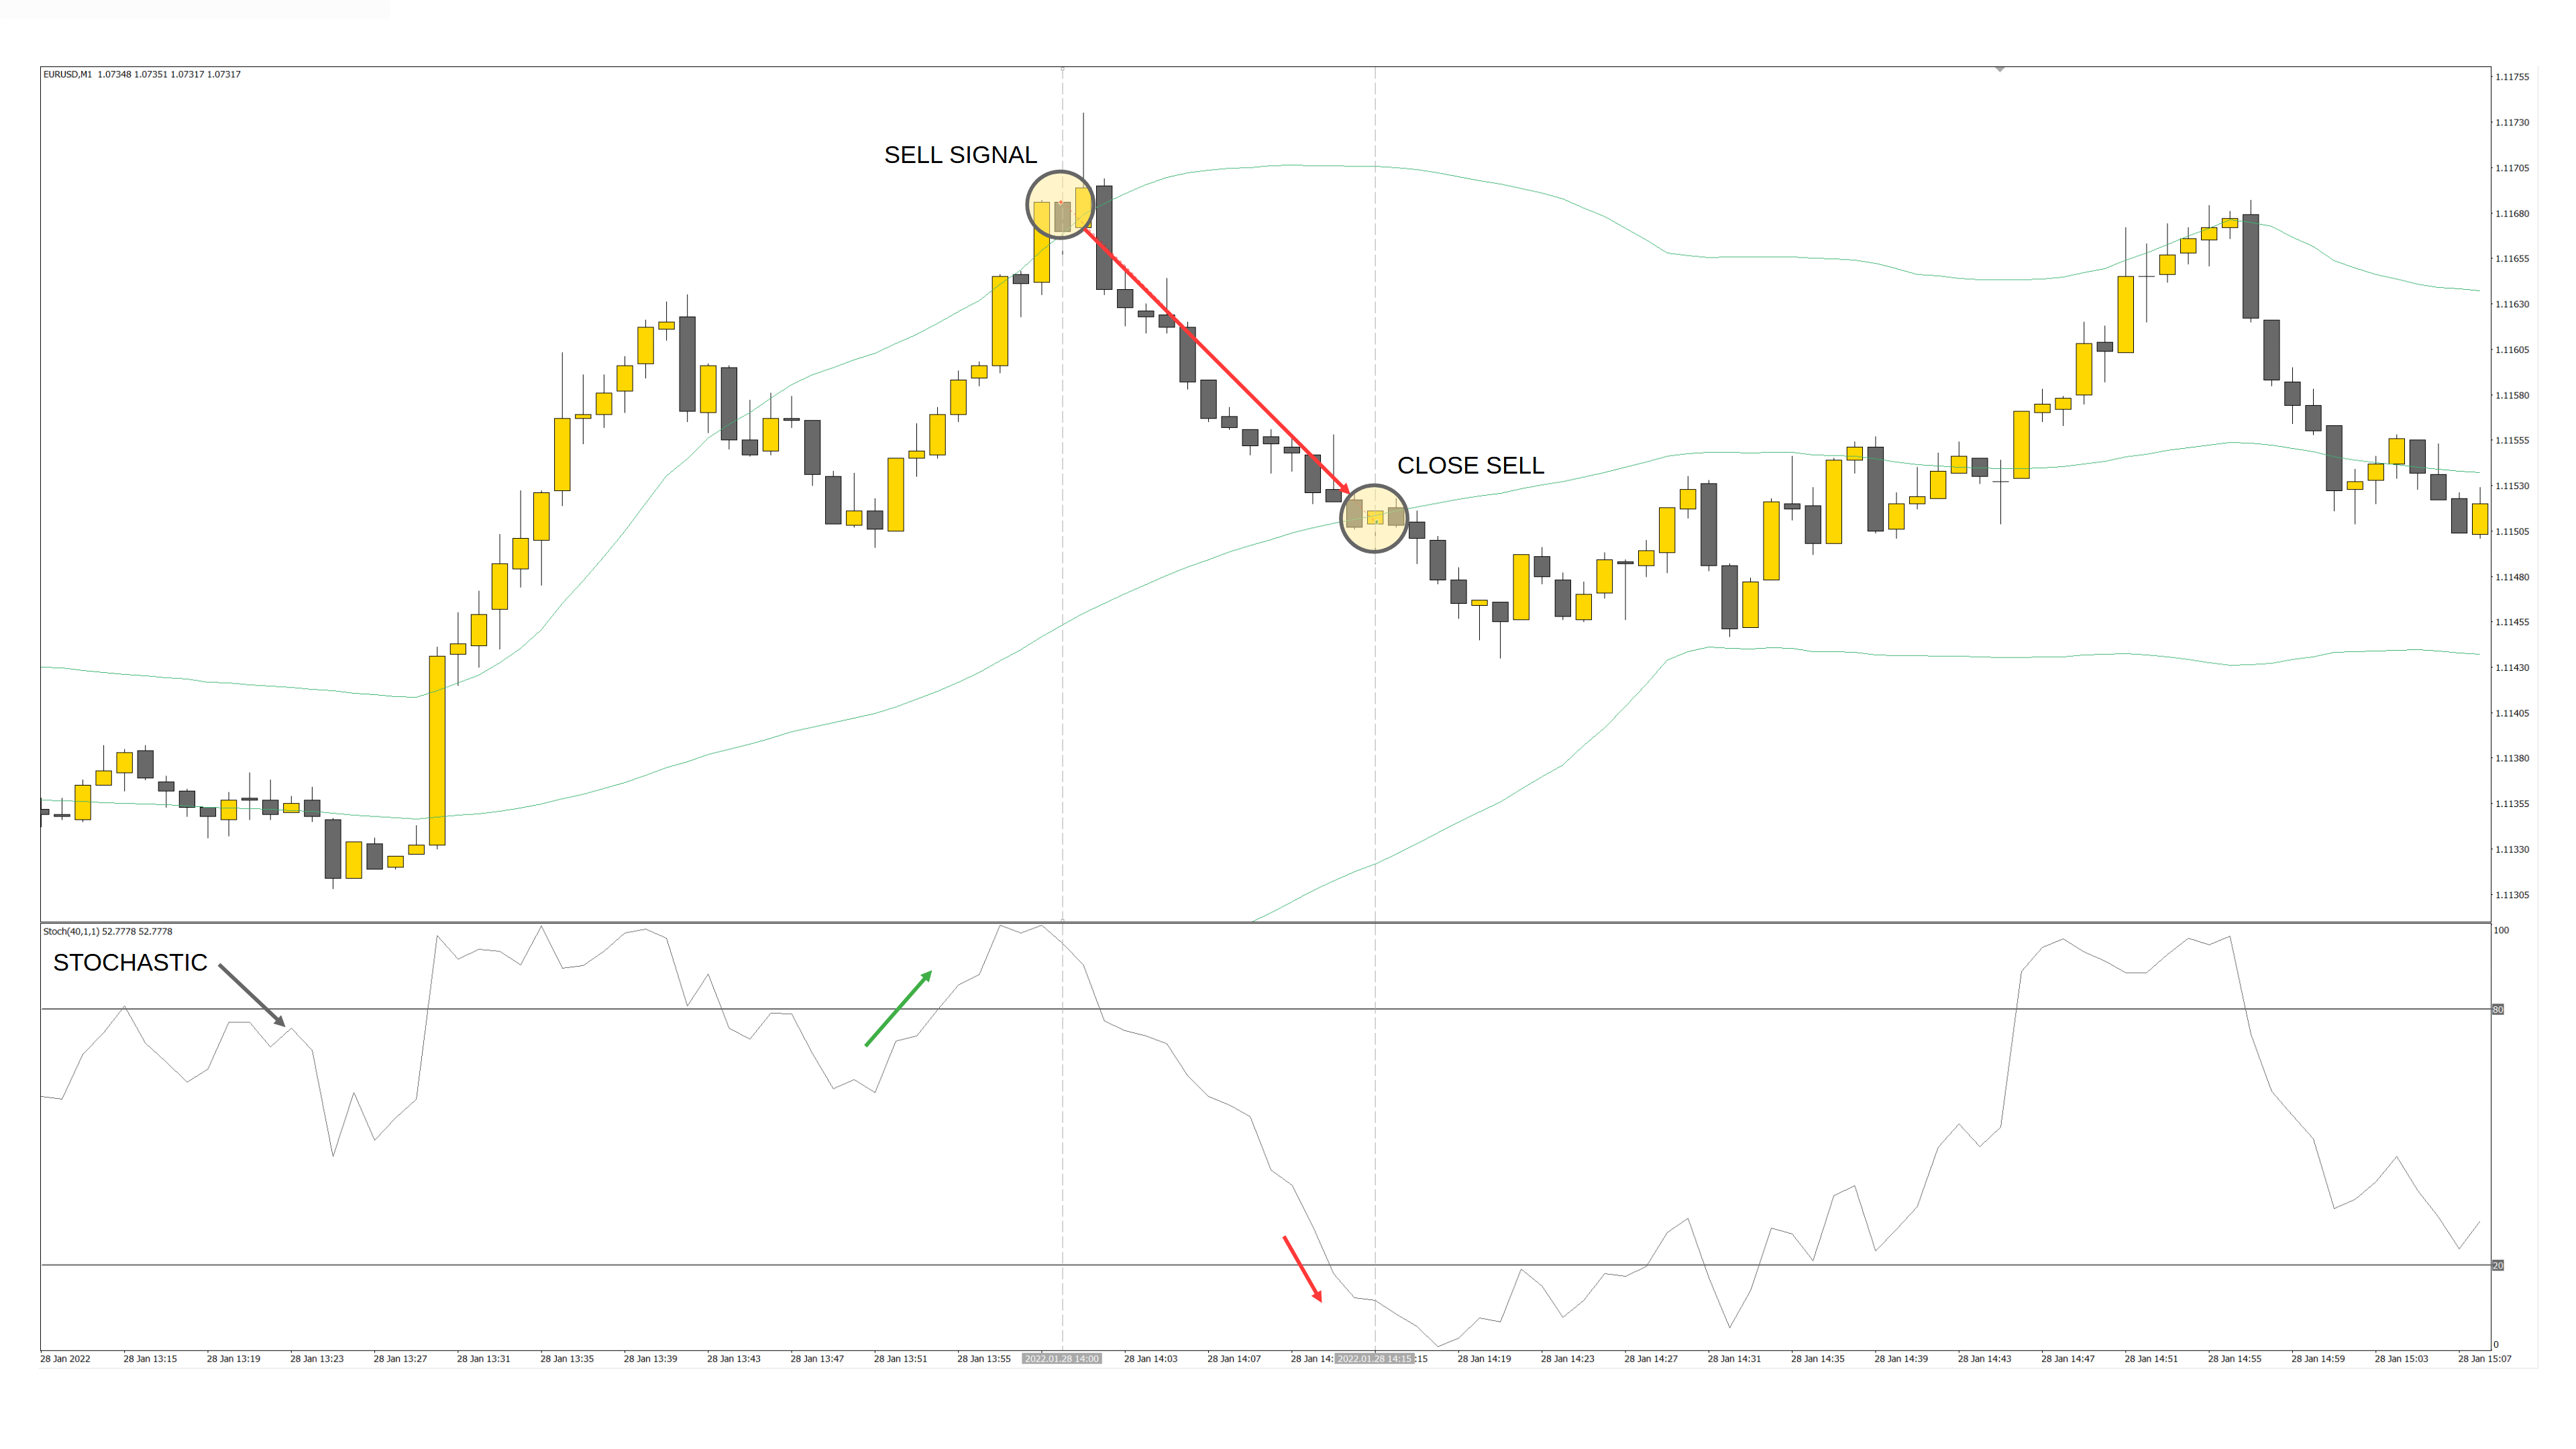
As I would like to find local price extrema – low for long trades – high for short trades, I need to somehow describe the current market price in relation to the previous market movements. I have chosen the MT4 Stochastic built-in indicator with very simplified inputs for that purpose. I do not use the %D line or Slowing (both set to 1, which will effectively disable their effect), but just a preset lookback window represented by the %K line. This setup enables you to see where the price is currently located in relation to maximum and minimum within this lookback. So the value of 0 would mean that the current price is at the minimum, and the value of 100 would mean that the current price is at the maximum for the specified lookback window. I combined multiple lookbacks to be able to see where the price is situated from each – the short, mid, and long-term perspectives. Then I look at the averaged value from all the lookbacks and wait for a preset threshold to be exceeded -> usually, the threshold values are set around 20 for long trades and 80 for short trades.
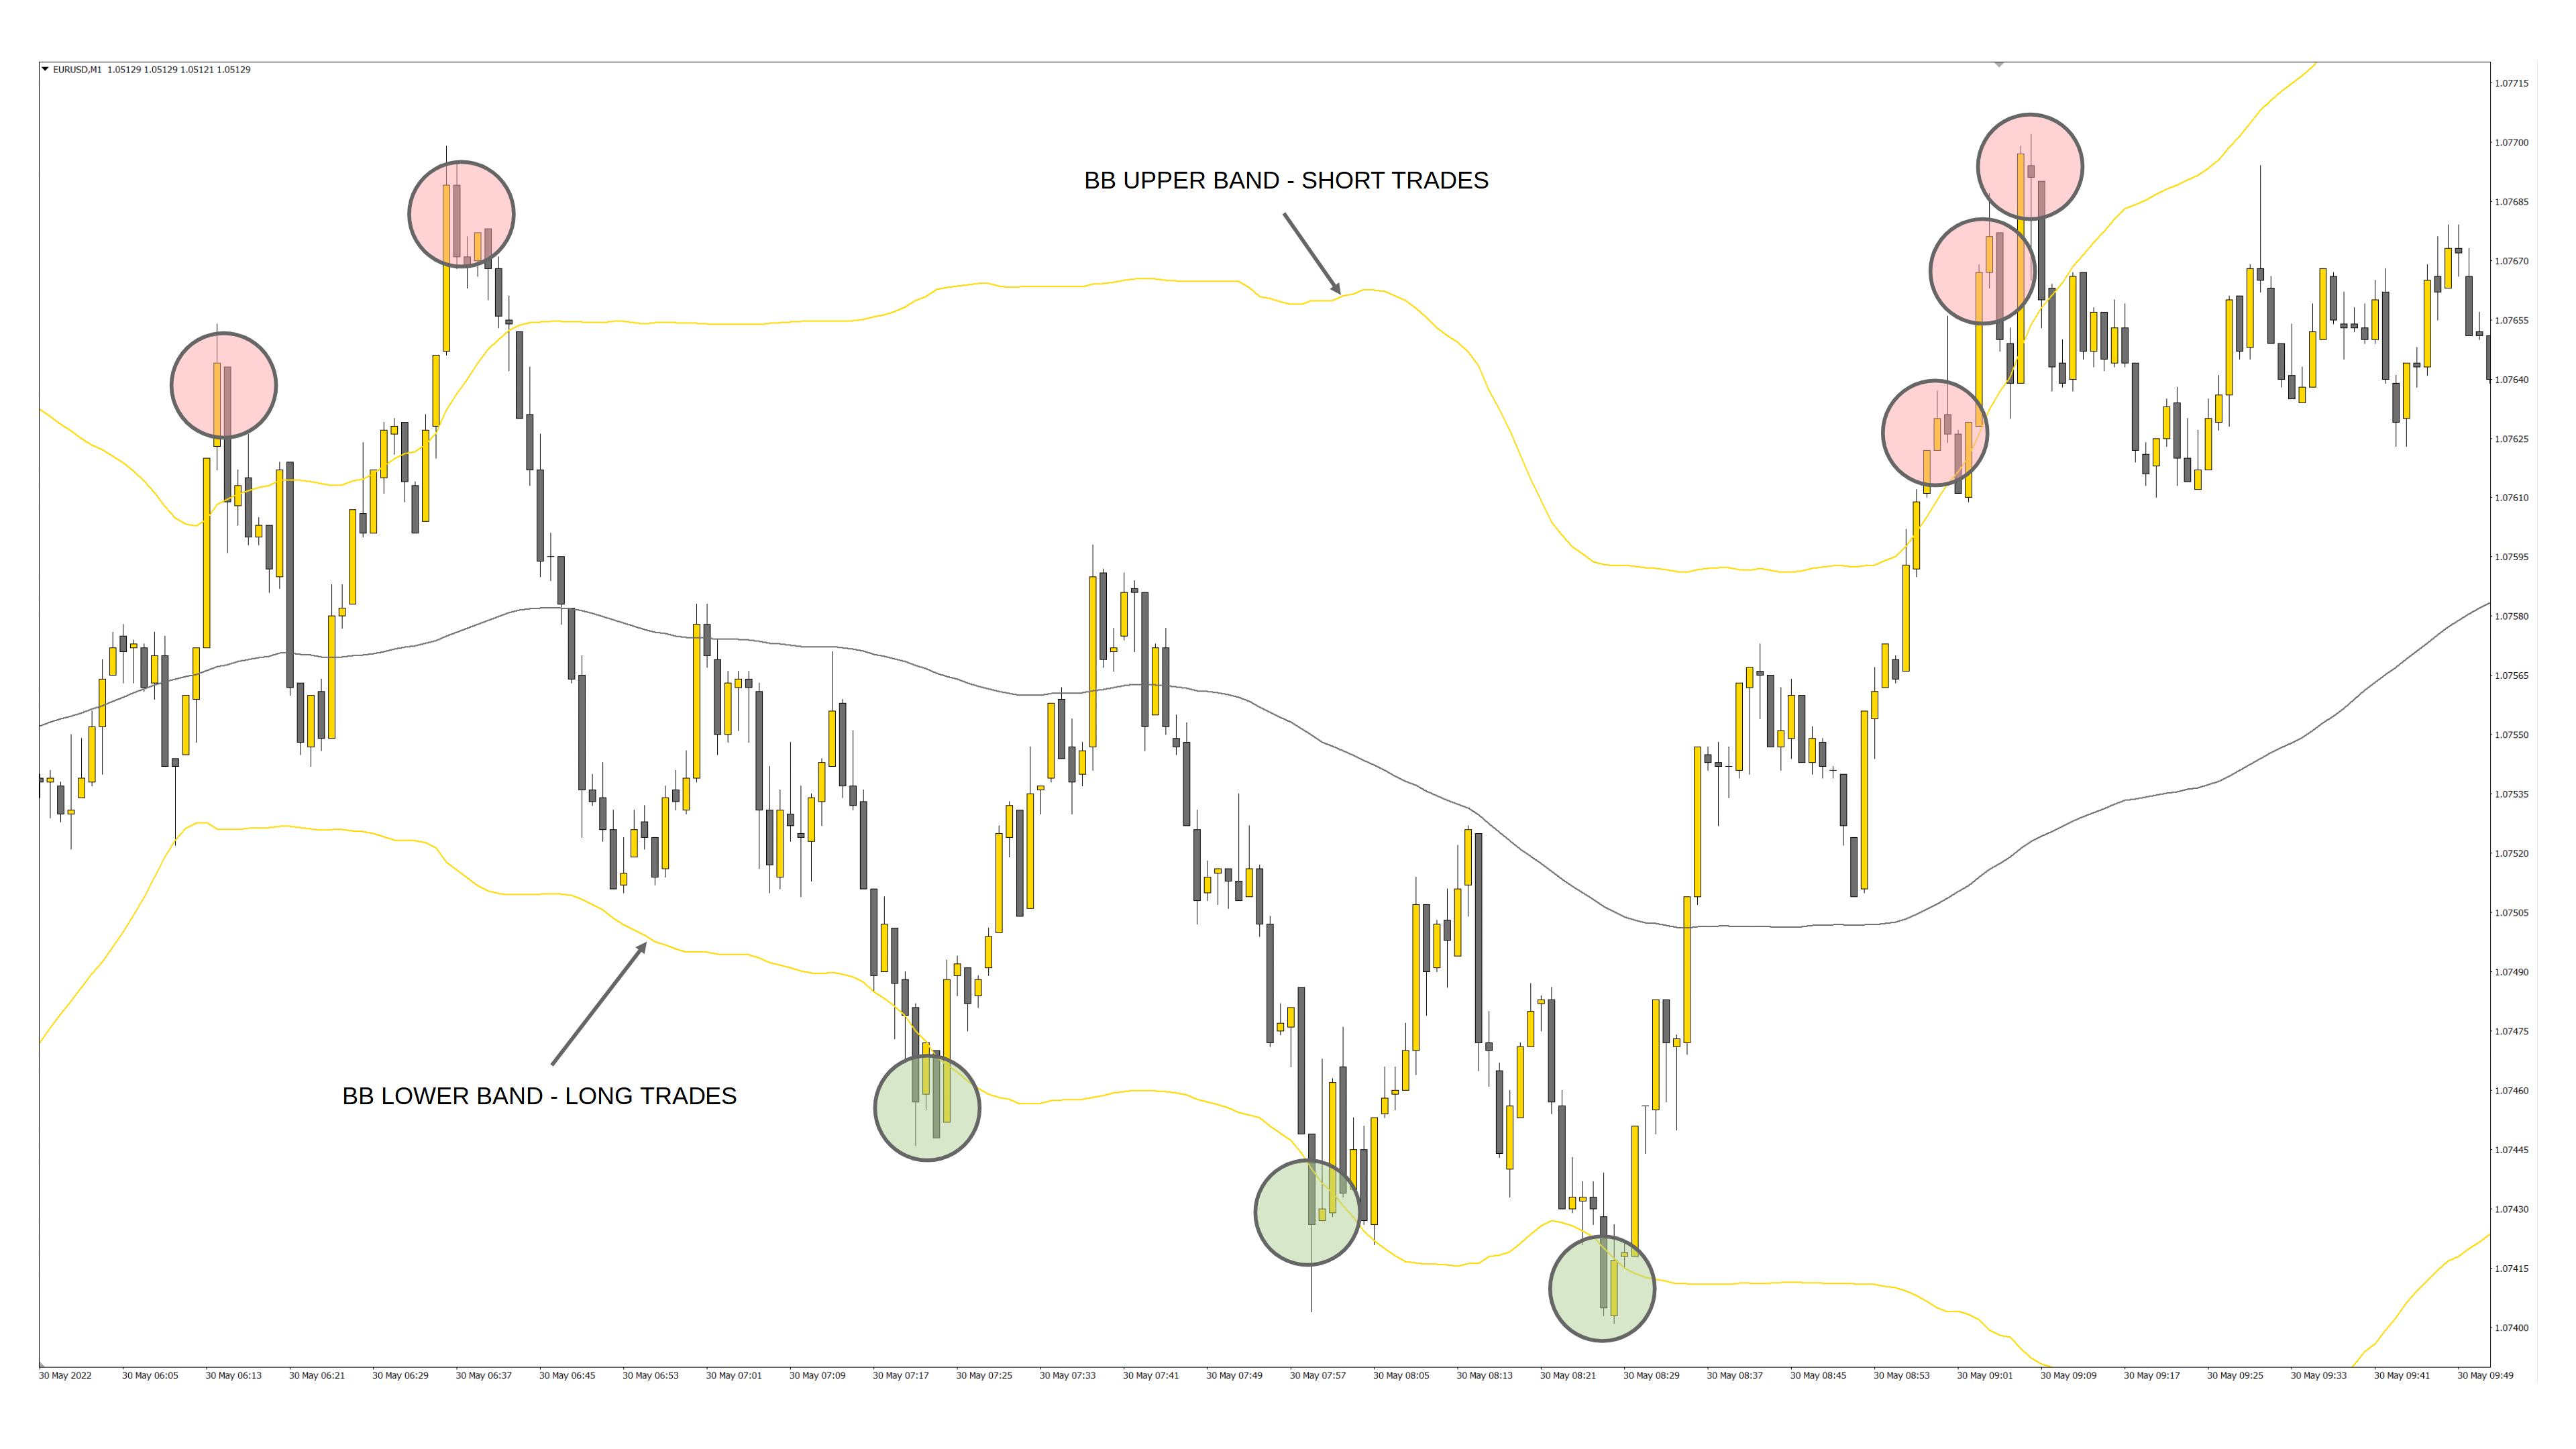
The second additional tool to confirm the overbought/oversold area is to find a way how to measure the strength and intensity of the previous market movement. It may be expected that if the previous movement was really sharp, or there was even a price spike, the market may be out of equilibrium and tend to return back. One of the useful tools for measuring the price deviation from its average (mean) value is also one of the built-in MT4 indicators – Bollinger Bands. You can play around with various lookbacks and deviations to see how frequently the price is located within the Bands and how often it breaks out. You can see that if the movement is not fast enough, the Bands tend to adjust quickly, and the price remains within. So this strategy only looks for movements when there is enough momentum to break out of the Bands. I also check whether the price exceeded the threshold of the averaged value from 3 of the lookbacks -> usually, I look for the price to be out of the two standard deviation zone.
So these were the conditions required to enter a trade. The logic behind closing the trades is almost the same. The only difference is that the strategy does not wait for the beginning of a new hour but makes decisions on every new minute. Also, opposing to the entry conditions which need to be fulfilled altogether, to close the trade, just one of the conditions needs to be valid. The price either exceeded the High/Low threshold, or there was a rapid movement outside the Bollinger Bands. The last possible close signal is whenever the trade profit exceeds the preset multiplier of the average volatility for the last hour -> for example, 5 x ATR(60).
Trade examples:
There are also some additional principles that improve the strategy stability during live trading. These are not exclusive to this particular strategy, but rather general principles resulting from live trading algoritmic trading strategies.
- No trade entries between 23:00 – 01:00 server time to prevent higher spreads and swaps during the rollover.
- No trade entries on Friday from 18:00 UTC and close all trades at 20:00 UTC to prevent holding positions over the weekend and paying swap points.
- Trade entries consider spreads – the higher spreads, the better the trade signal needs to be to fulfill all the conditions. This may result in higher trading activity at brokerages with lower spreads due to more valid trade signals.
Strategy inputs:
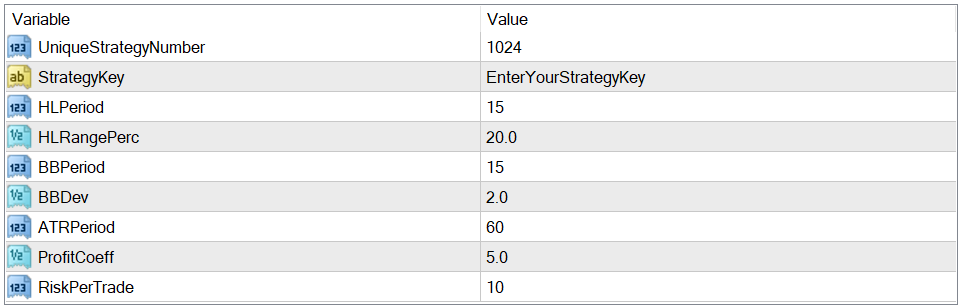
- UniqueStrategyNumber – Unique strategy identifier (Magic Number), each running strategy should have a different UniqueStrategyNumber.
- StrategyKey – A unique key that is used to activate the strategy on a particular account. You can generate the strategy key here using your account number (only accounts registered at one of our trusted brokers will be accepted).
- HLPeriod – Period settings for the shortest of the Stochastic indicators.
- HLRangePerc – Entry range precision percentage. For example value of 20 means entry is allowed within 20% from high/low.
- BBPeriod – Period settings for the shortest of the Bollinger Bands indicators.
- BBDev – Standard Deviation multiplier for calculating the Upper/Lower Bands.
- ATRPeriod – Period settings for the ATR indicator.
- ProfitCoeff – Coefficient for calculating profit target as a multiplier of the ATR value.
- RiskPerTrade – Maximal single trade loss allowed in the case of critical market movement. It acts rather as a safety mechanism for the black swan events and sets the server-side SL. The strategy should manage the losing trades by itself much more effectively. Based on the number of running strategies, I set this value somewhere between 5 % and 20 % – the more running strategies, the lower the risk per one instance.
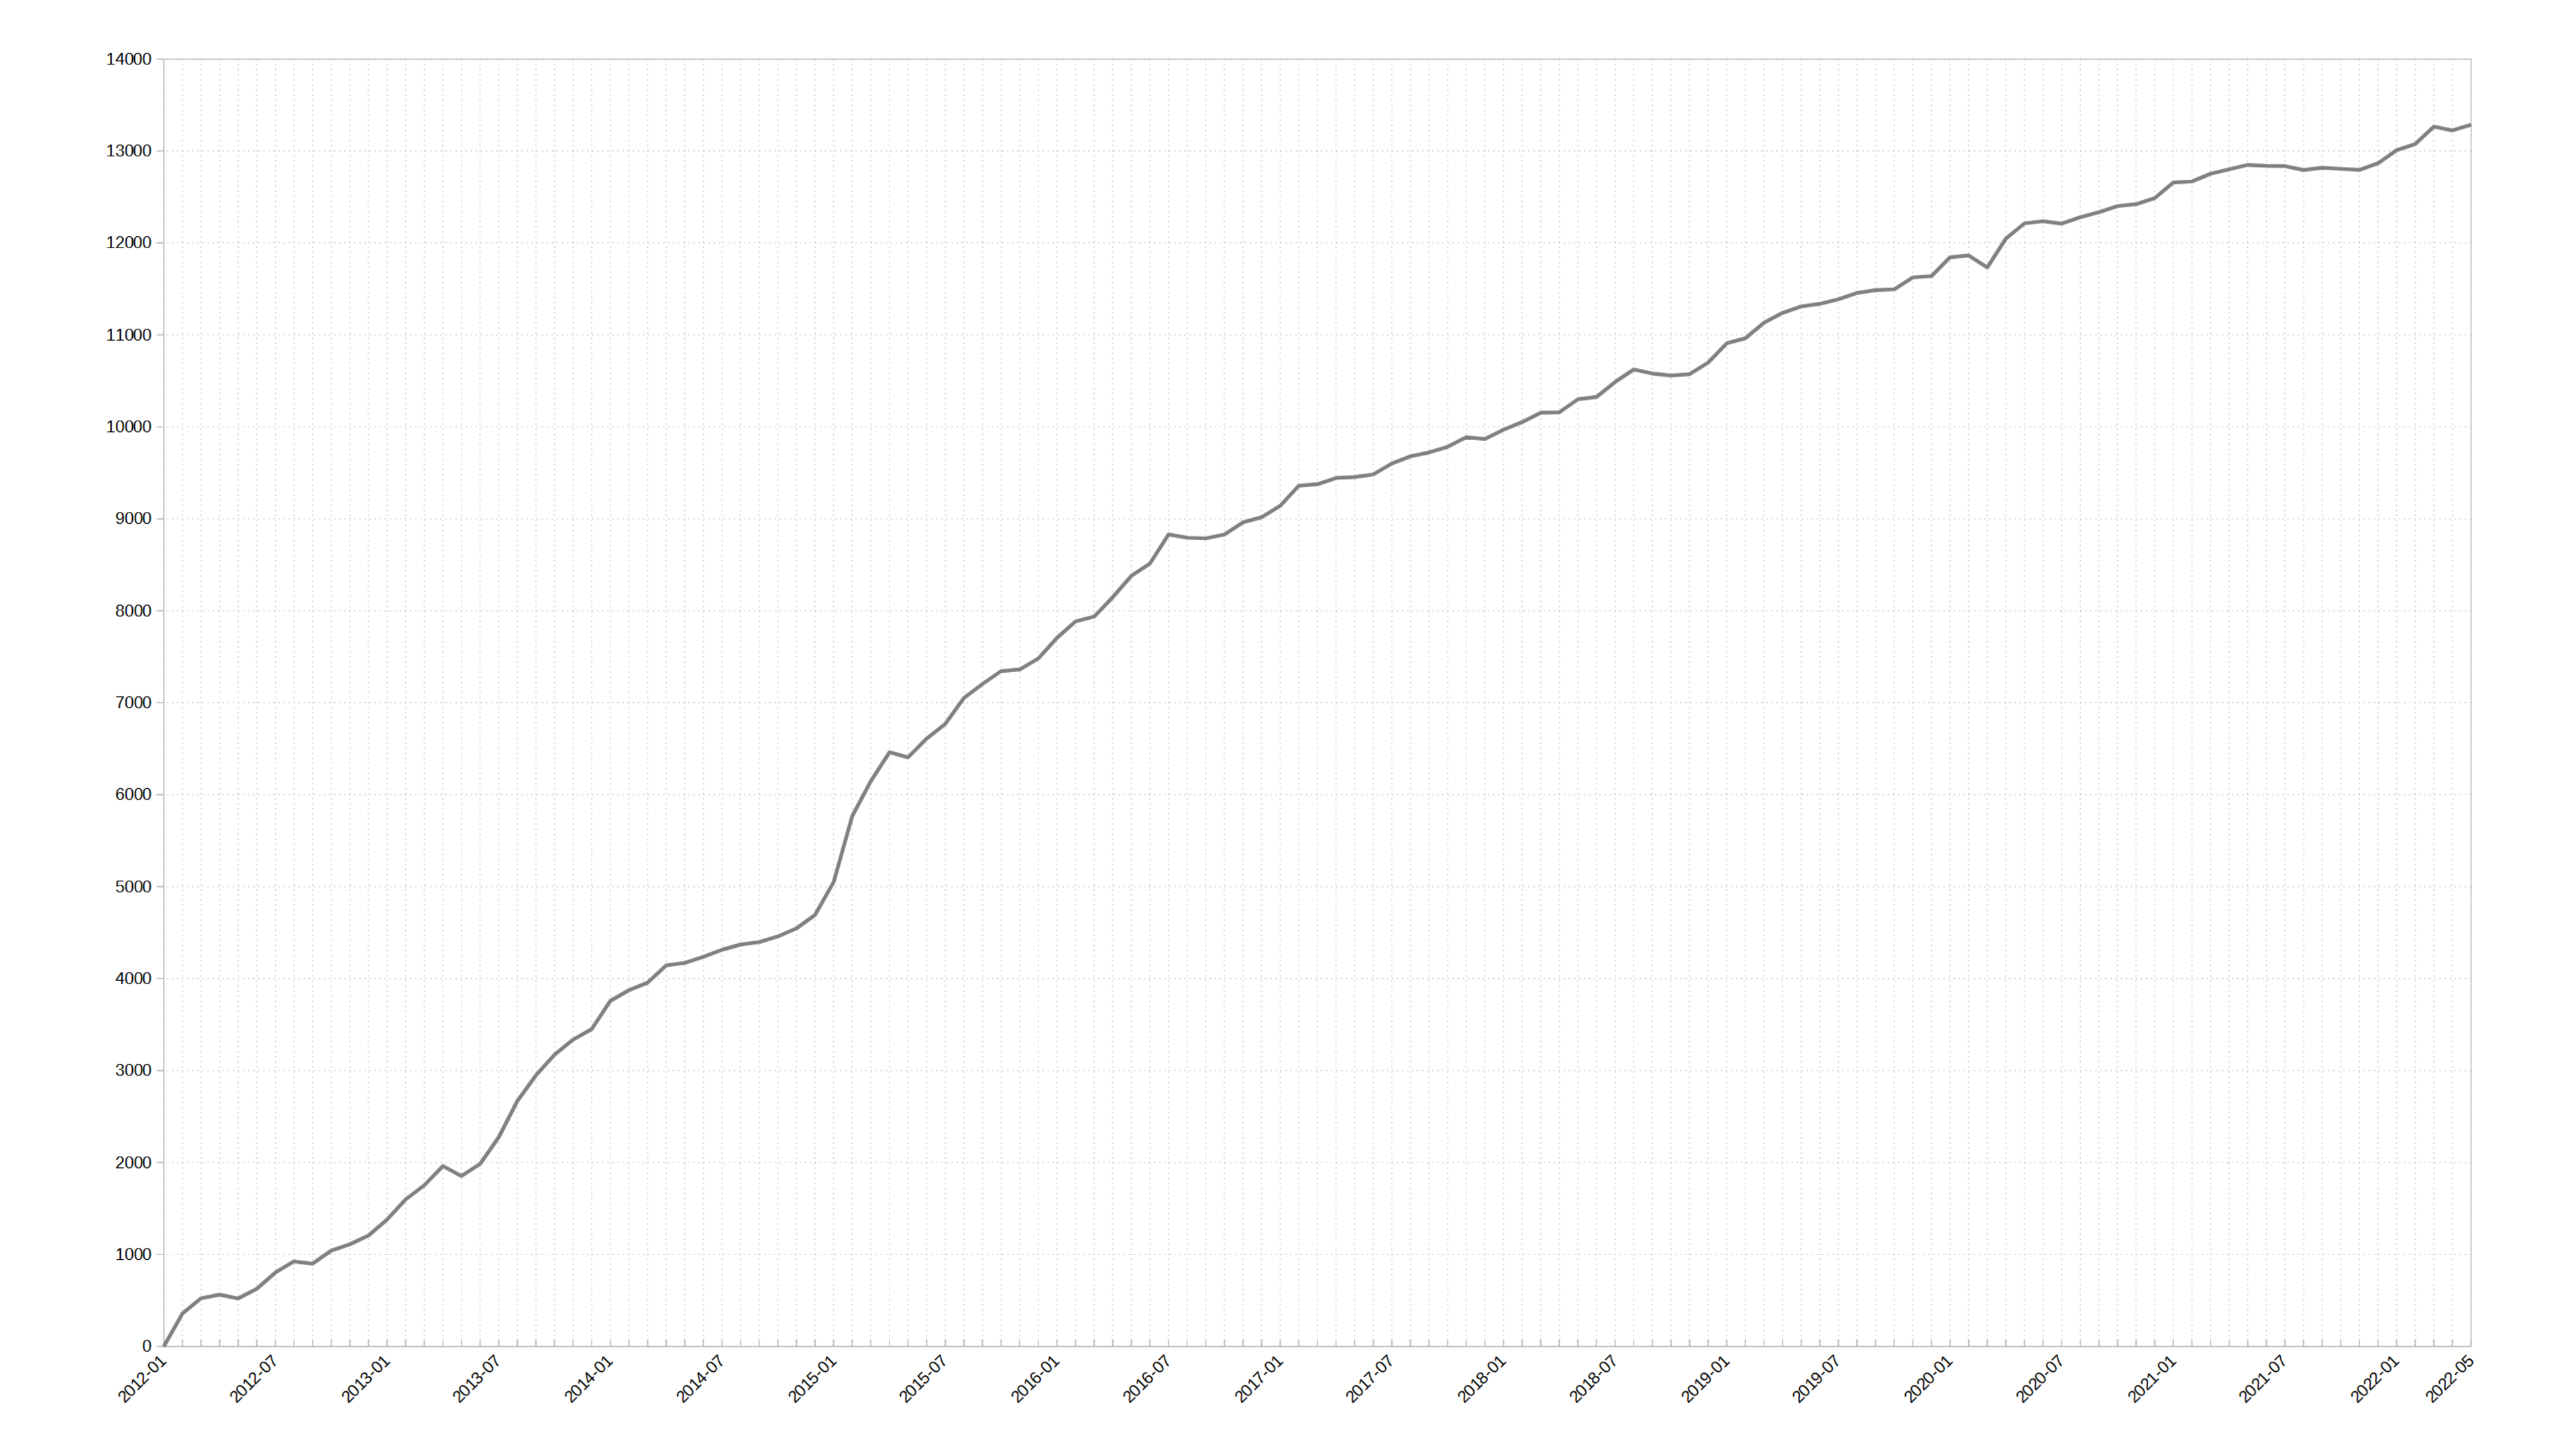
Backtest Historical Performance
- Starting deposit: $1000
- FX pairs: AUDCAD, AUDCHF, AUDJPY, AUDNZD, AUDUSD, CADCHF, CADJPY, CHFJPY, GBPAUD, GBPCAD, GBPCHF, GBPJPY, GBPNZD, GBPUSD, EURAUD, EURCAD, EURCHF, EURGBP, EURJPY, EURNZD, EURUSD, NZDCAD, NZDCHF, NZDJPY, NZDUSD, USDCAD, USDCHF, USDJPY
- Testing Period: 1.1.2012 – 29.5.2022
- Average yearly profit: 132.8% (Without position scaling)
- (Max) Risk per trade: 5%
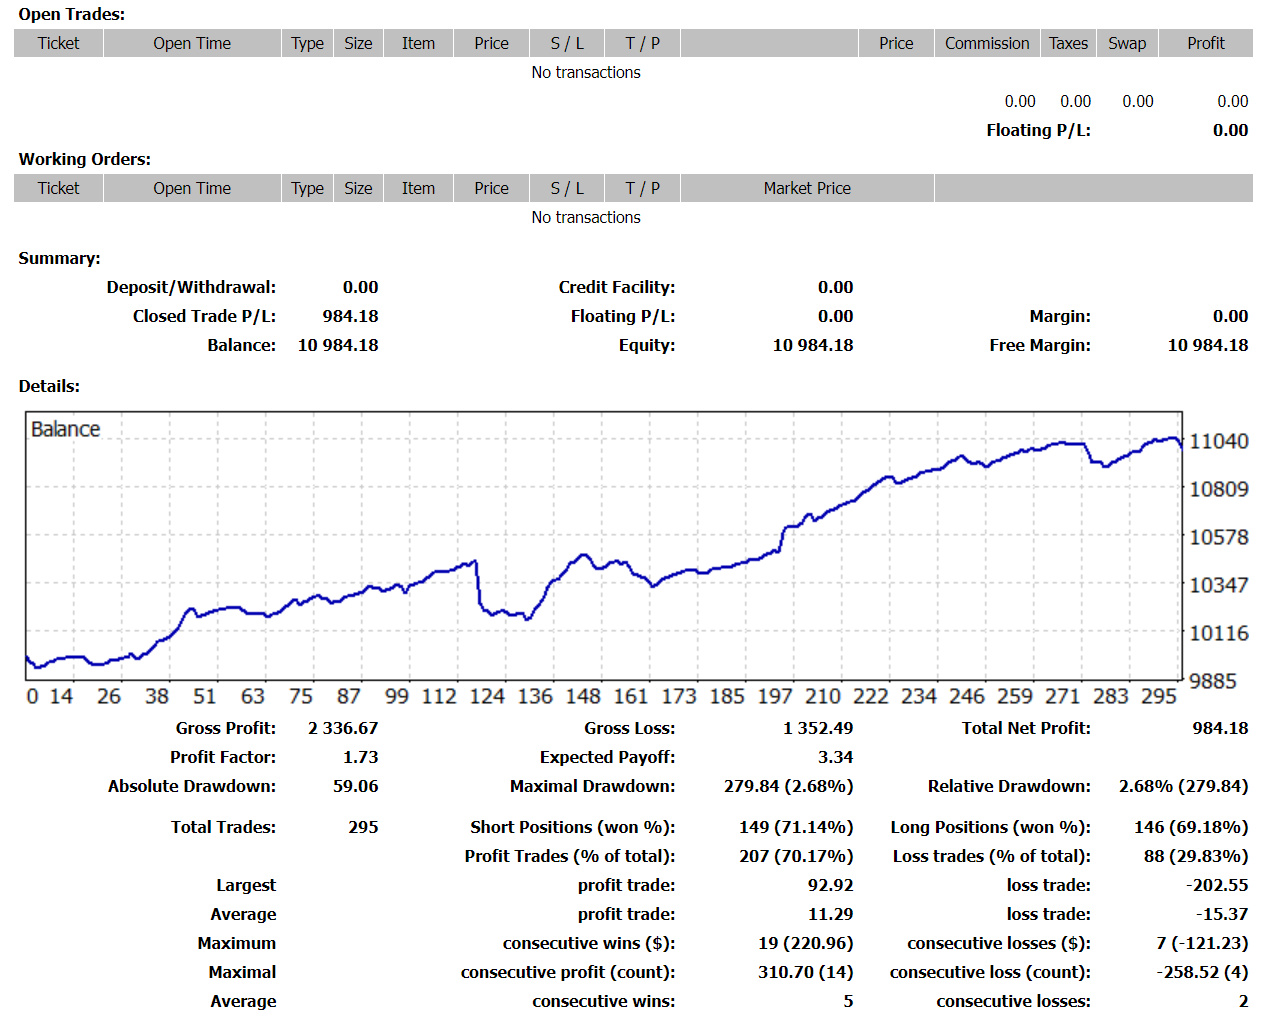
Demo testing
I have already put the strategy to the test on a demo account, and it seems it works technically as it was designated and even proved some of its performance. You can see the result below.
Final Thoughts – Real trading
After two weeks of testing, I think it is the appropriate time to put the strategy to the real test with real money. I prepared a $1000 account where I will run the strategy to see how it operates in a real trading environment. I will share the results from this account on a regular basis so you can follow me and see how the strategy behaves, its ups and downs, and its overall performance. But most importantly, I will share all my thoughts on upgrades and additional features that could potentially help the strategy to increase its performance and ensure better stability.
Still, have no trading account yet? Open an account at one of my trusted brokers suitable for algorithmic trading completely for free and start testing today!
This post contains affiliate links. If you use these links to register at one of the trusted brokers, I may earn a commission. This helps me to create more free content for you. Thanks!

