How to Backtest EX4 Strategy

This post contains affiliate links. If you use these links to register at one of the trusted brokers, I may earn a commission. This helps me to create more free content for you. Thanks!
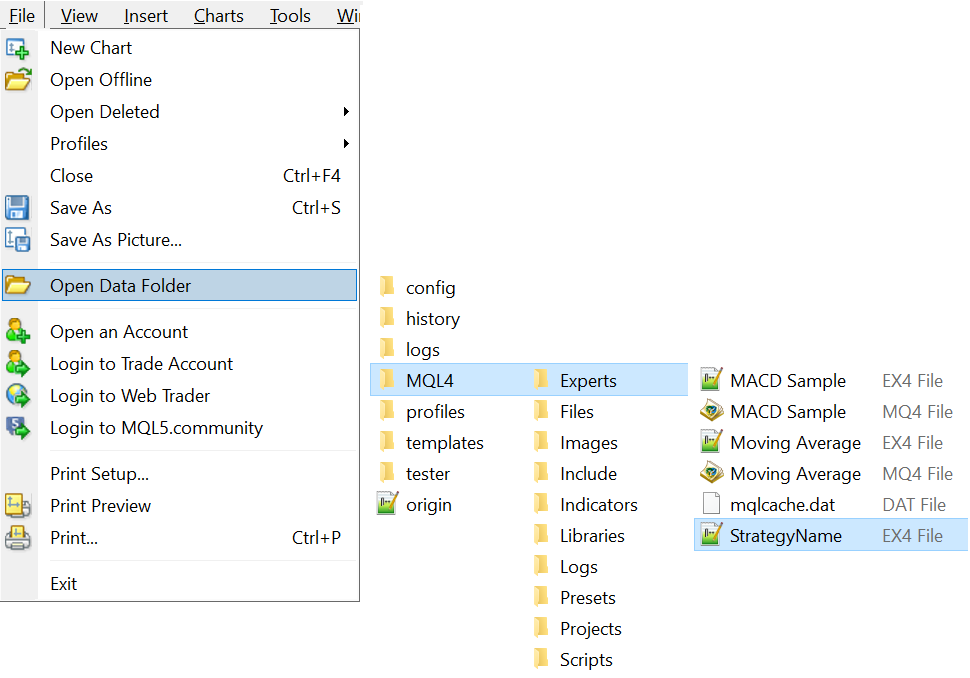
Download the desired Strategy (Expert Advisor) in EX4 format from our website, or you can create an EX4 file when you edit and compile code in MQ4 format.
Open the MT4 Terminal and log into your account. If you do not have the MT4 terminal and demo account installed yet, you can proceed by creating a new one account at one of my Trusted Brokers.
Before you start doing anything, make sure the EX4 file is placed in the Experts folder in the Terminal Data Folder.
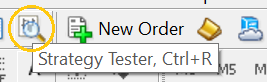
In your MT4 terminal, open the Strategy Tester using the icon (with magnifying glass) or Ctrl+R shortcut.
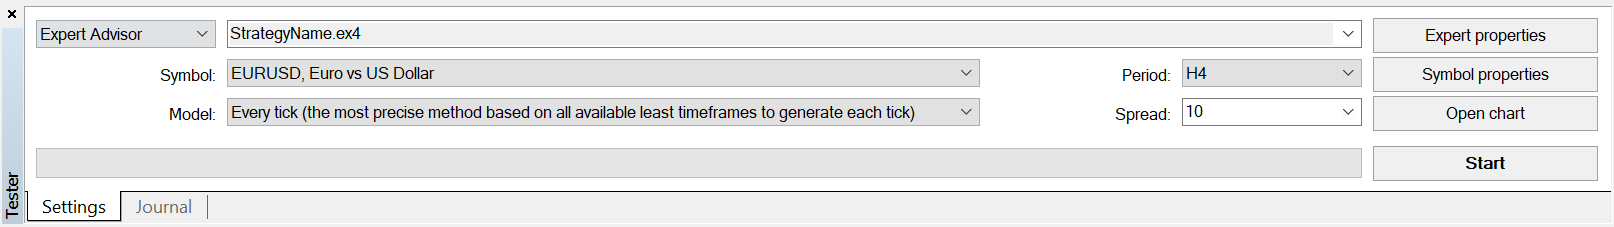
If successfully done, the strategy tester window should appear on the bottom part of your terminal. The window should be organized, as below. If you do not see all the options shown below, it is caused by the window’s insufficient height. You can increase the height by dragging the upper edge upward as the cursor changes to a double-pointed arrow.
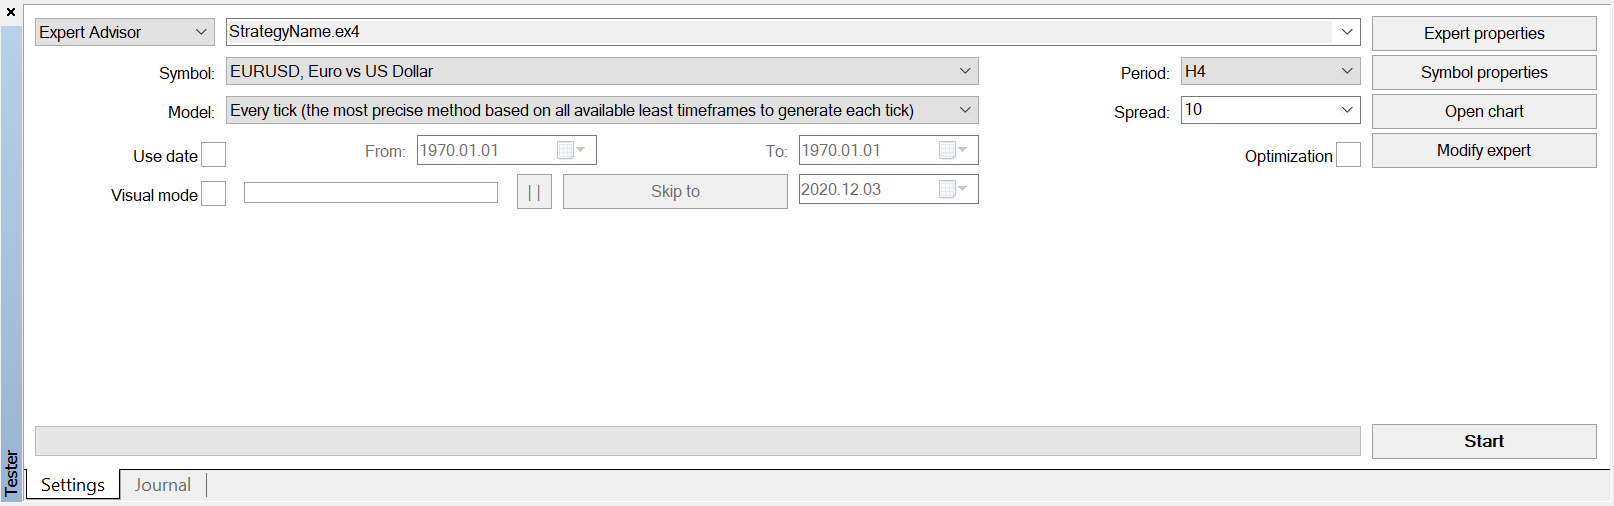
There are numerous options within the Strategy Tester. I will focus on the most straightforward way to test the strategy, and a more detailed description of individual parts will be covered in specialized posts.
Qick step-by-step guide:
- Select Strategy
- Select Symbol
- Select Testing Model
- Set Time Range
- Visual Mode (Optional)
- Set TimeFrame
- Set Spread
- Set Expert Properties
- Hit Start
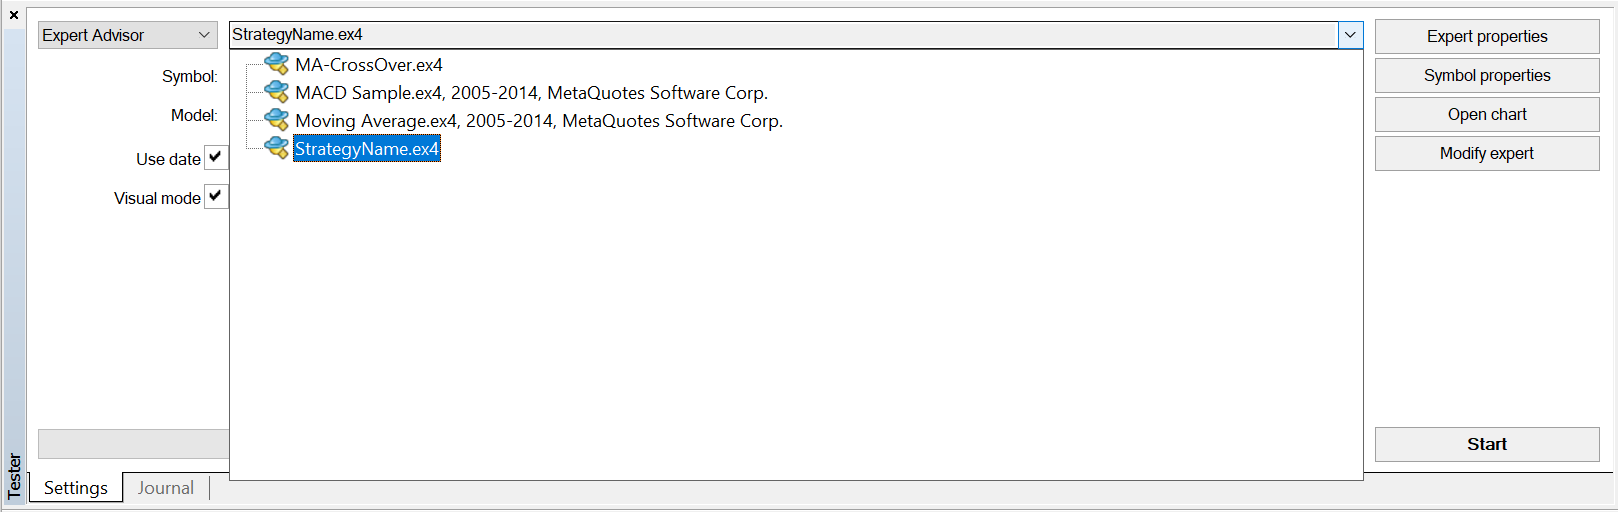
1. Select a strategy you would like to test by expanding the first column.
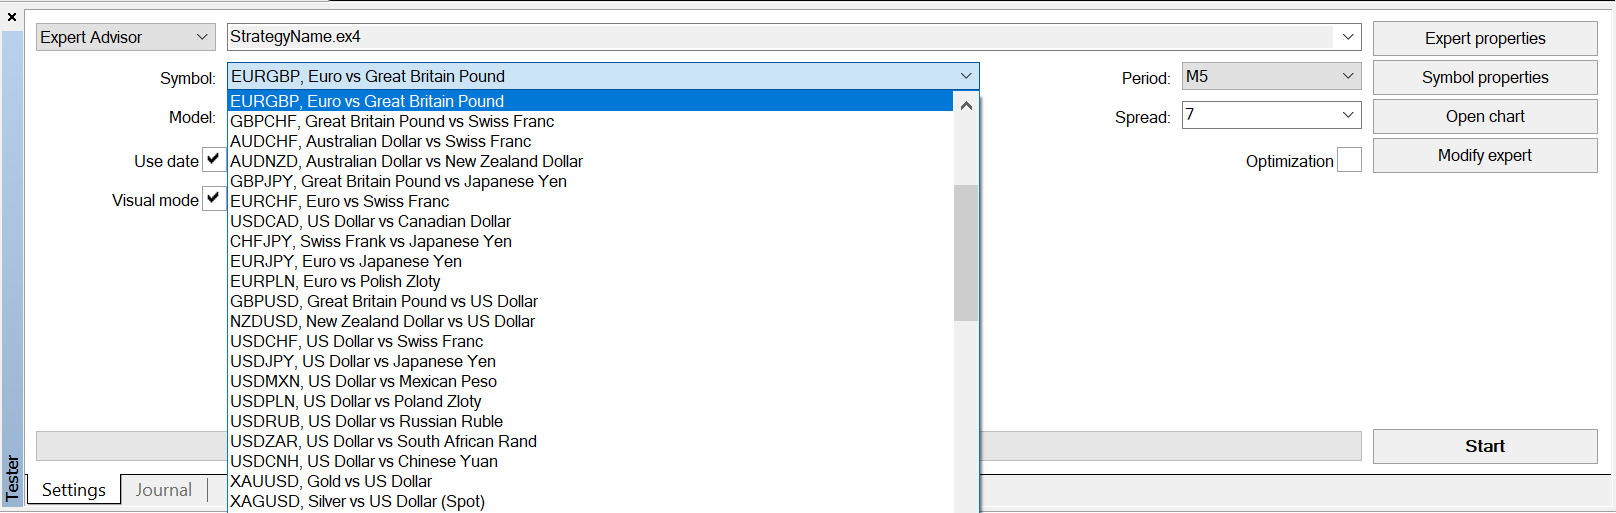
2. Select any of the supported symbols. When you are connected to the trading server, the list should correspond with your broker’s offer of trading instruments.
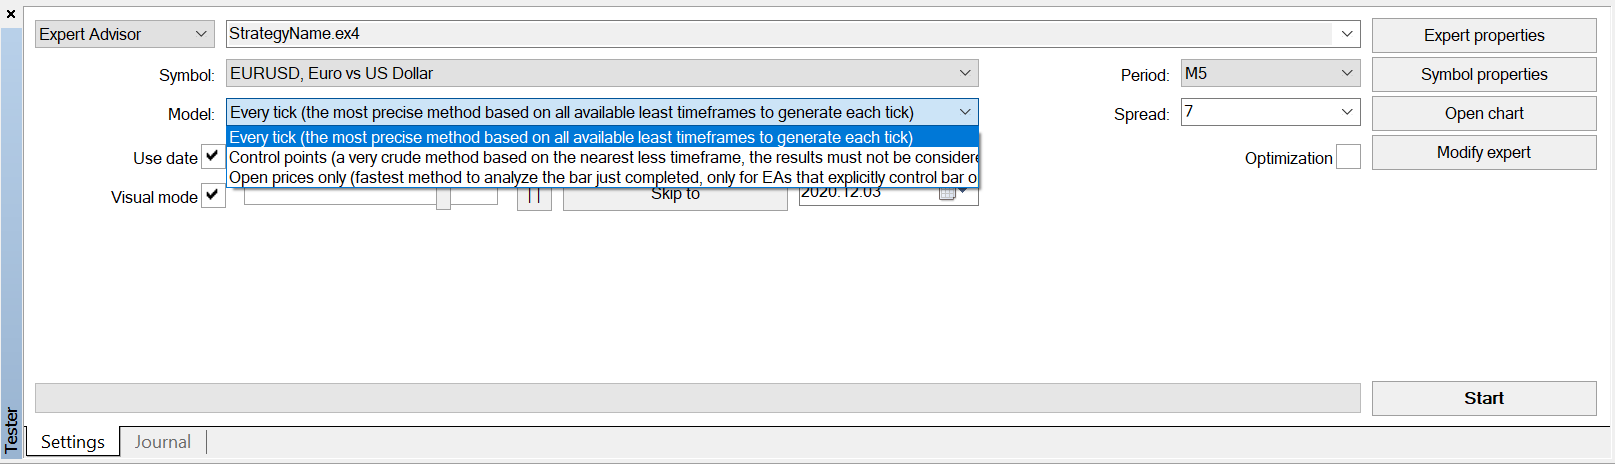
3. Select the testing model.
Every tick: Most precise and most time-consuming method, all the prices within all the intervals will be covered in the test. If you do not perform extensive testing, always use this method.
Control Points: Rough method to evaluate the basic functionality of the Strategy. The nearest lower timeframe will be used as the guidance for the modeling of the particular interval.
Open Prices: The least precise method, where only the opening price of each interval is used. This high-speed method can be used only for specific Strategies. StopLoss, TakeProfit, or TrailingStop cannot be used since these features are strongly dependent on the movement within the interval.
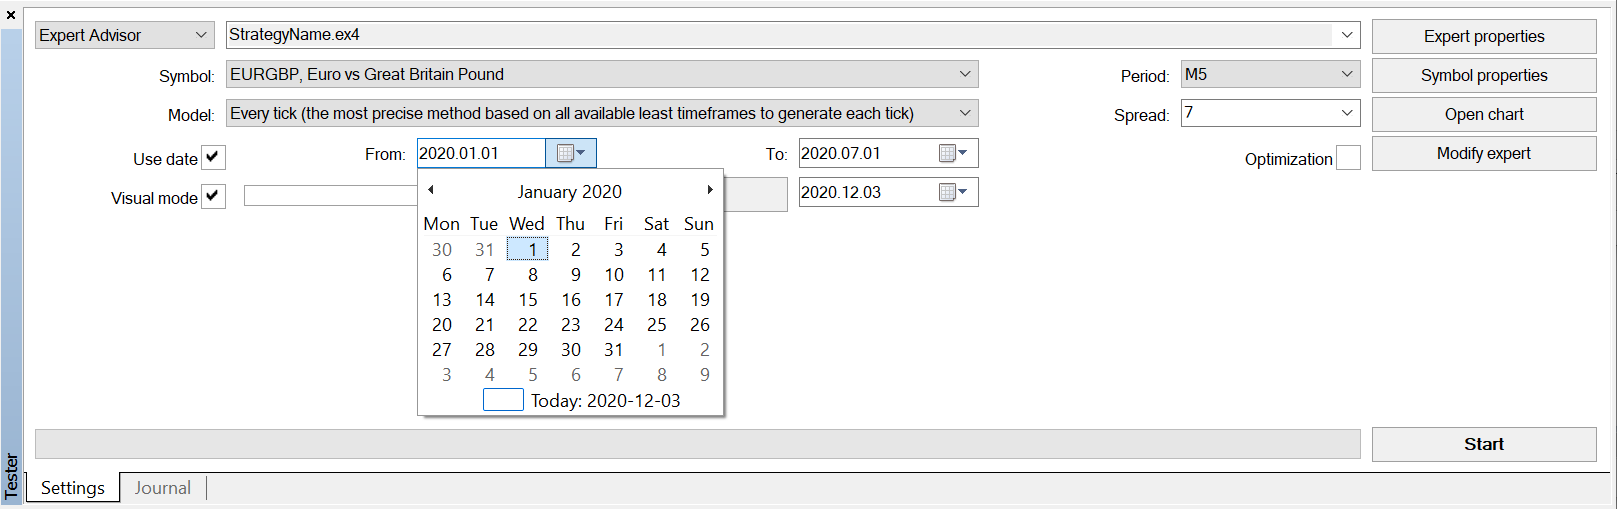
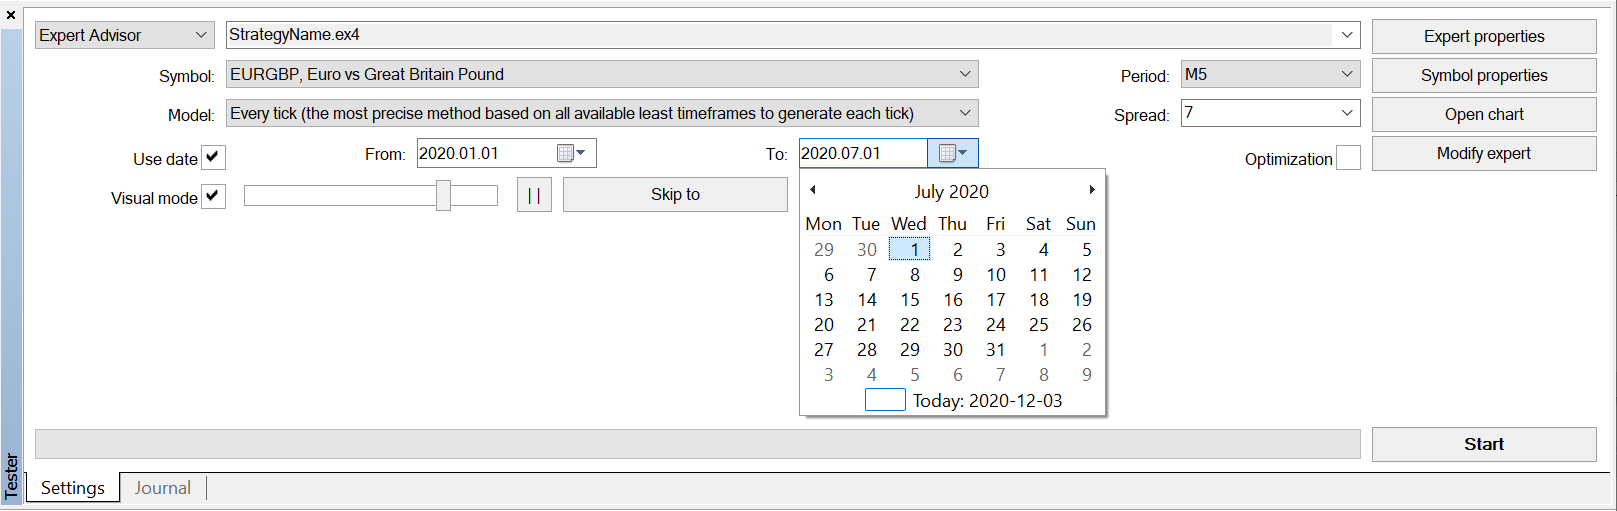
4. Set the time range of your test. The data has to be available in the history center (F2). If you do not tick the “Use date,” all available data will be used. To get all the data available from your broker’s server, open the chart for the desired symbol and timeframe, disable the auto-scroll of the chart, and hold the Home key. The MT4 will be forced to backfill all the available data.
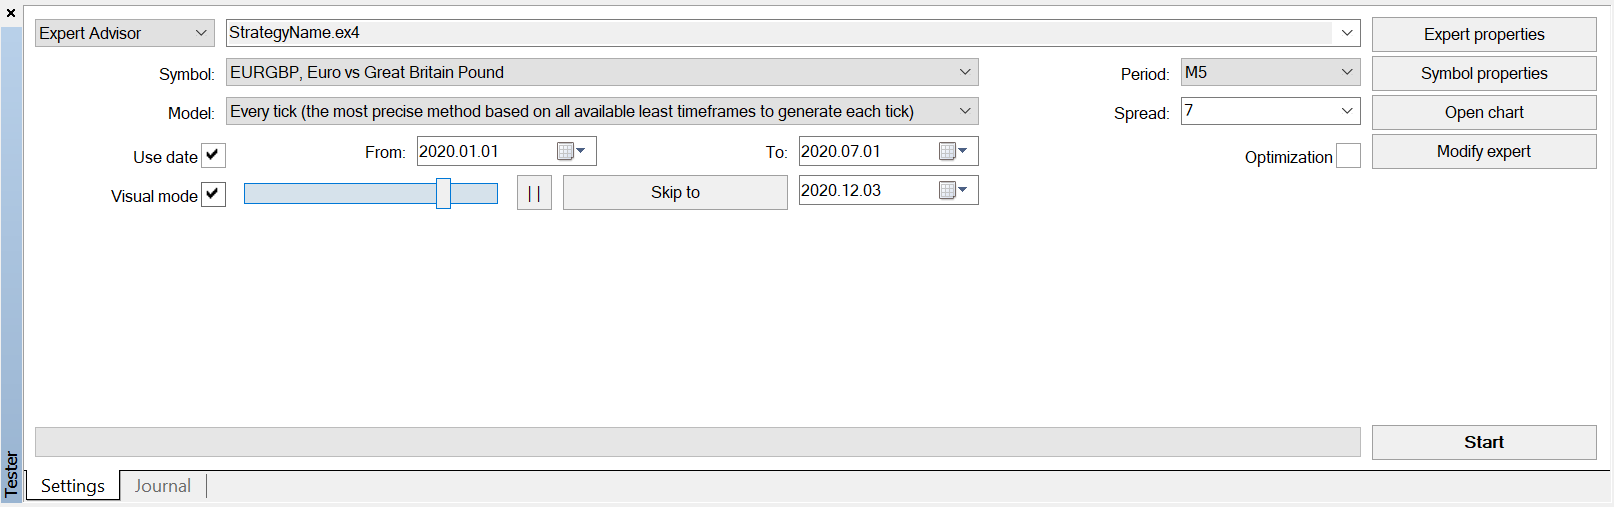
5. You can tick the Visual mode column to see the whole test running in the newly opened chart window. This is useful, especially when debugging, optimizing, or adding new features to the strategy. Everything will be visualized in the same manner as you see in real live trading.
During the testing, you can move the scrollbar or use the mouse wheel to adjust the speed or stop it using the | | sign. By clicking on the “Skip to” button, the testing will stop visualizing and process all the remaining data up until the specified date. Do not use this “Skip to” function when testing wider data ranges, and you don’t need to see the trades visualized. During the skipping part, the tests run much slower than usual, and it will waste a lot of your time.
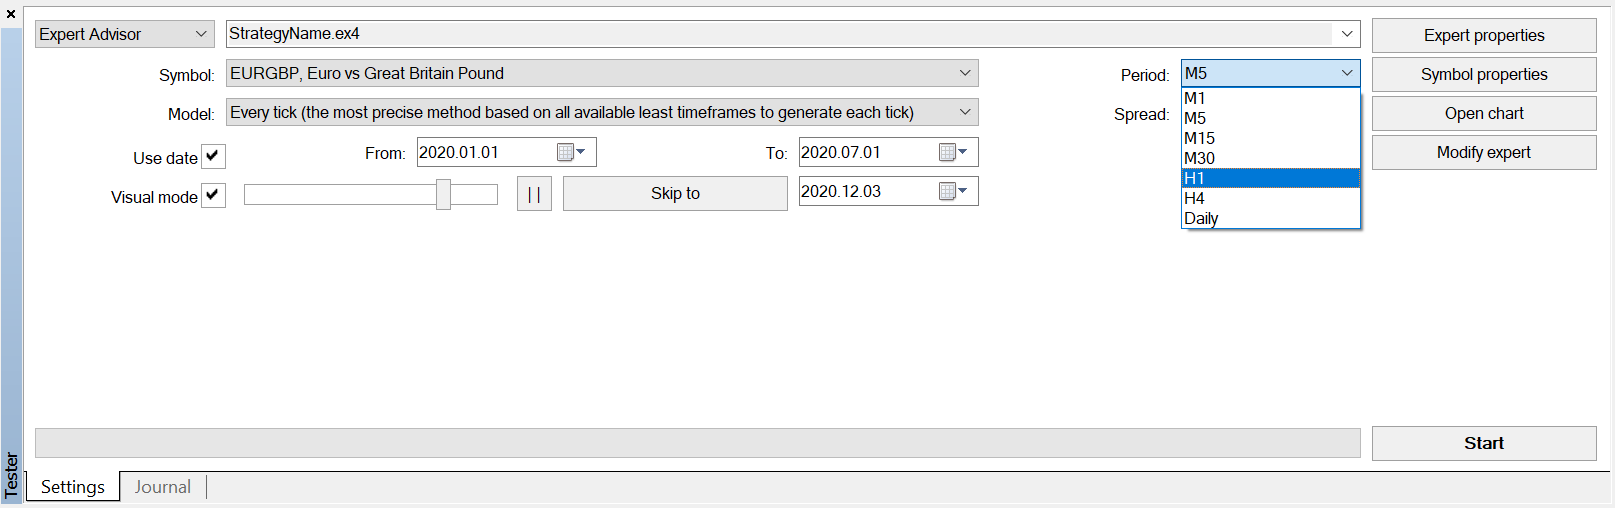
6. Set the TimeFrame you would like your Strategy to be tested on. I prefer to use rather lower timeframes because you can get and work with much more detailed information than with the higher ones. You can easily adjust the Strategy to a higher timeframe, but vice-versa it may be very hard.
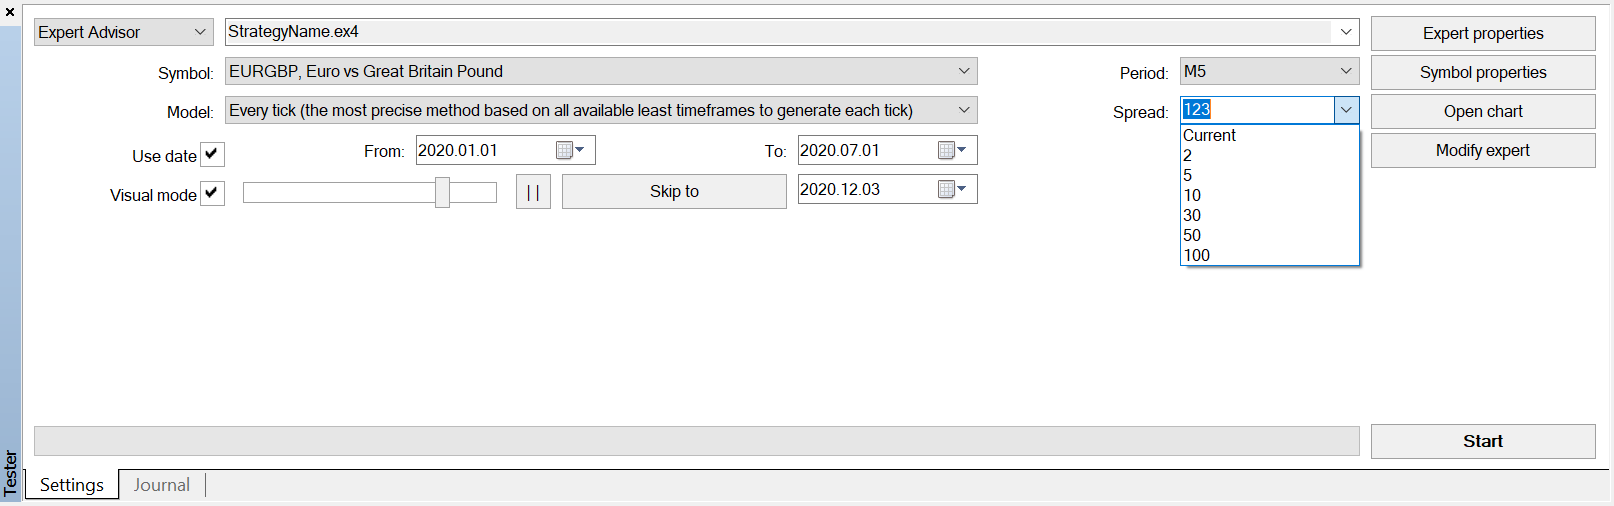
7. Set the Spread that will be used in the test. Fill in the spread by typing a specific number into the column or select one from the predefined values. The “Current” spread will use the real-time quote from your broker that is available at the exact time when you start testing. This value will vary, so you will get different results for the same setup each time, which is not desirable.
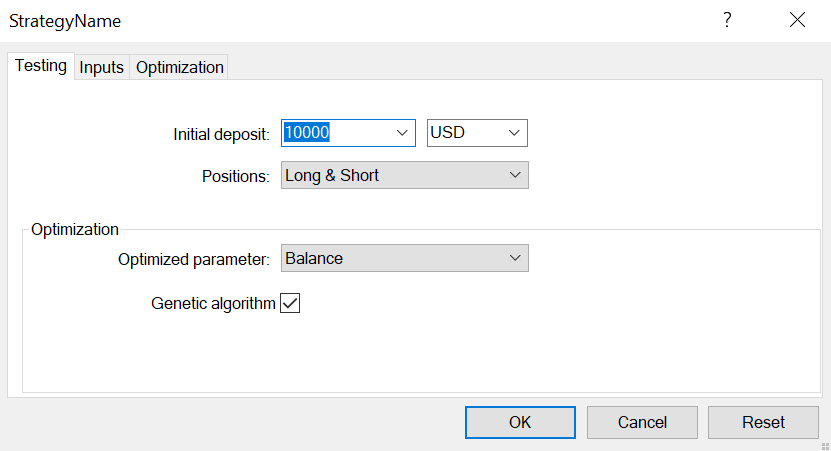
8. Hit the Expert properties button to set all the Strategy and testing inputs. There are 3 tabs that 2 of which need to be set for backtesting:
Testing: Set the initial deposit that will be used at the start of the testing. I tend to set a value close to the amount of my free real funds intended for trading. That way, I can see and experience the possible risks and better understand the nature of the strategy. You can limit the trades to just one direction – long/short, which may be sometimes useful, but be prepared to see some log errors (in the Journal tab) after the testing is finished.
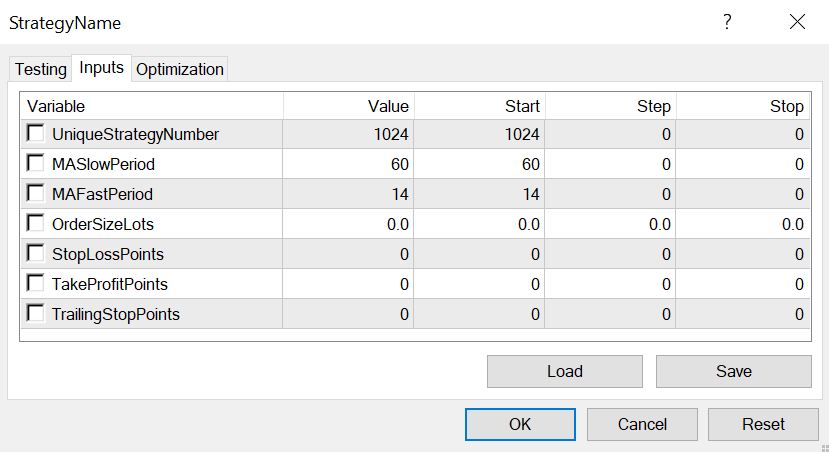
Inputs: This will probably be your most visited tab when testing or optimizing any strategy. Here you can set all the inputs that directly control the behavior of the strategy. By adjusting the values, you can test and compare the same strategy with different settings.
The most commonly used inputs you will come across could be the period settings for indicators, trade volume, StopLoss/TakeProfit distance, or other crucial trading parameters. Each strategy will have a different set of inputs based on its logic.
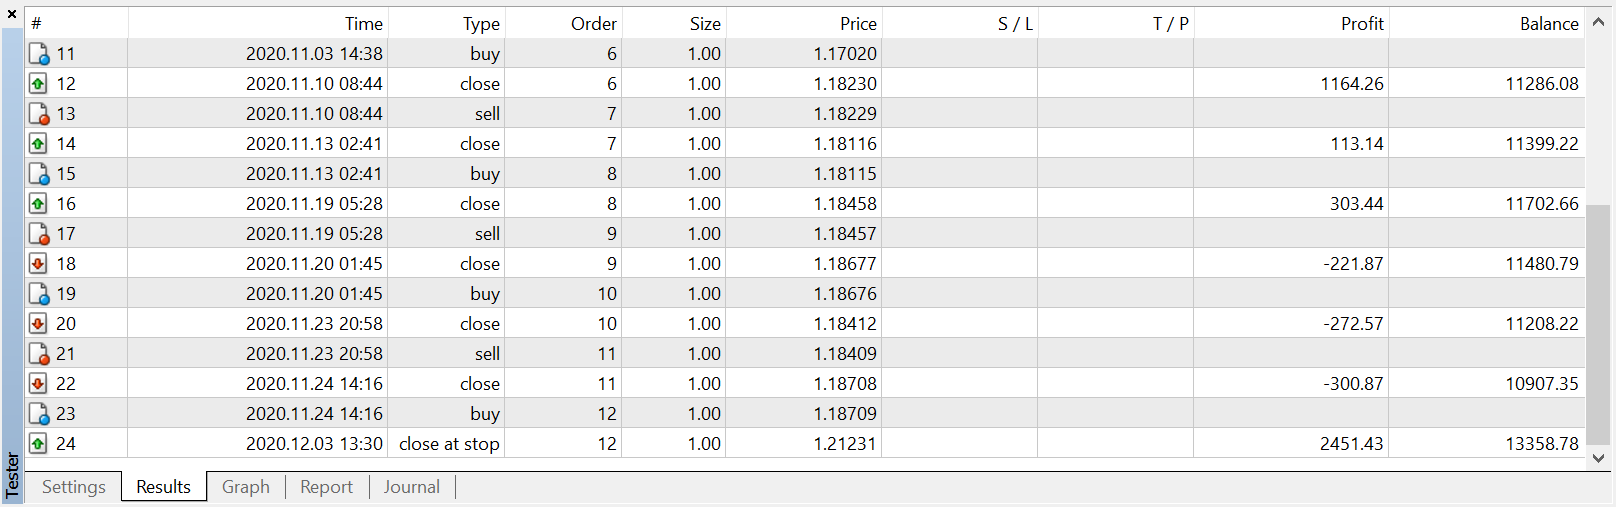
9. When everything is set, you can hit the Start button, and the testing will begin. After the progress bar representing the data gathering for the tester is completed, all the available data will be processed, and the trades operations will be performed based on the algorithm and settings. Also, 3 new tabs on the bottom part of the Strategy Tester will appear – Results, Graph, and Report.
Results: Here, you will find all the trading operations (Open, Close, Modify) performed during the test and crucial additional information.
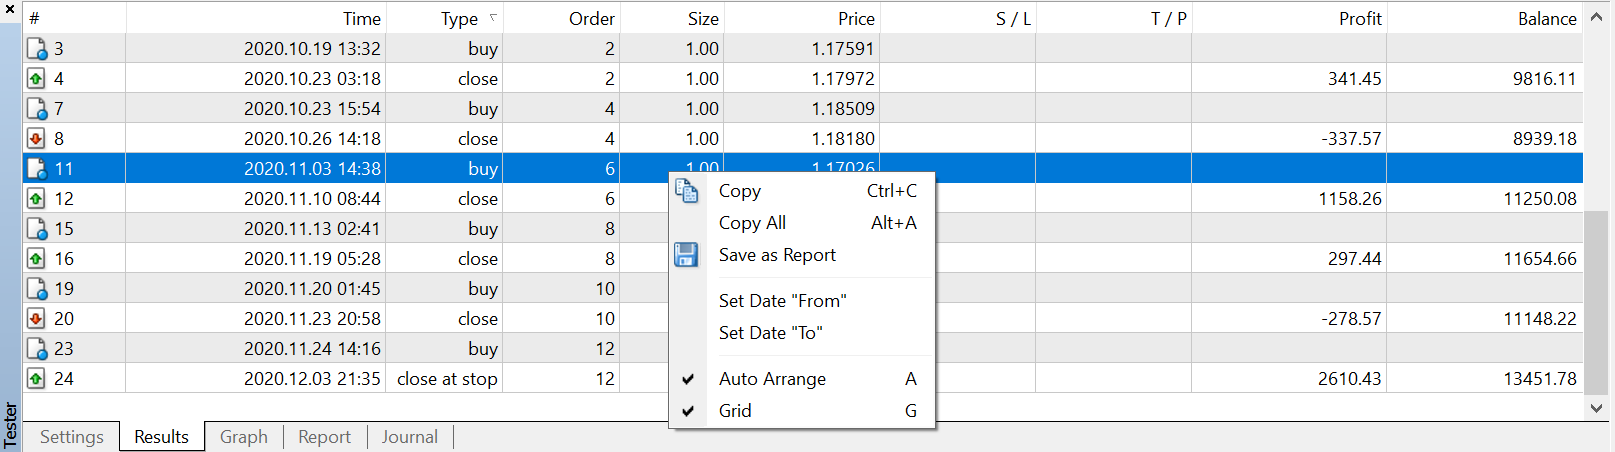
If you right-click anywhere into the table of the results, further options will appear. You can copy the results (Alt+A) and then paste the data to any spreadsheet software (like MS Excel or LibreOffice Calc) easily for further processing. You can also generate the generic MT4 report.
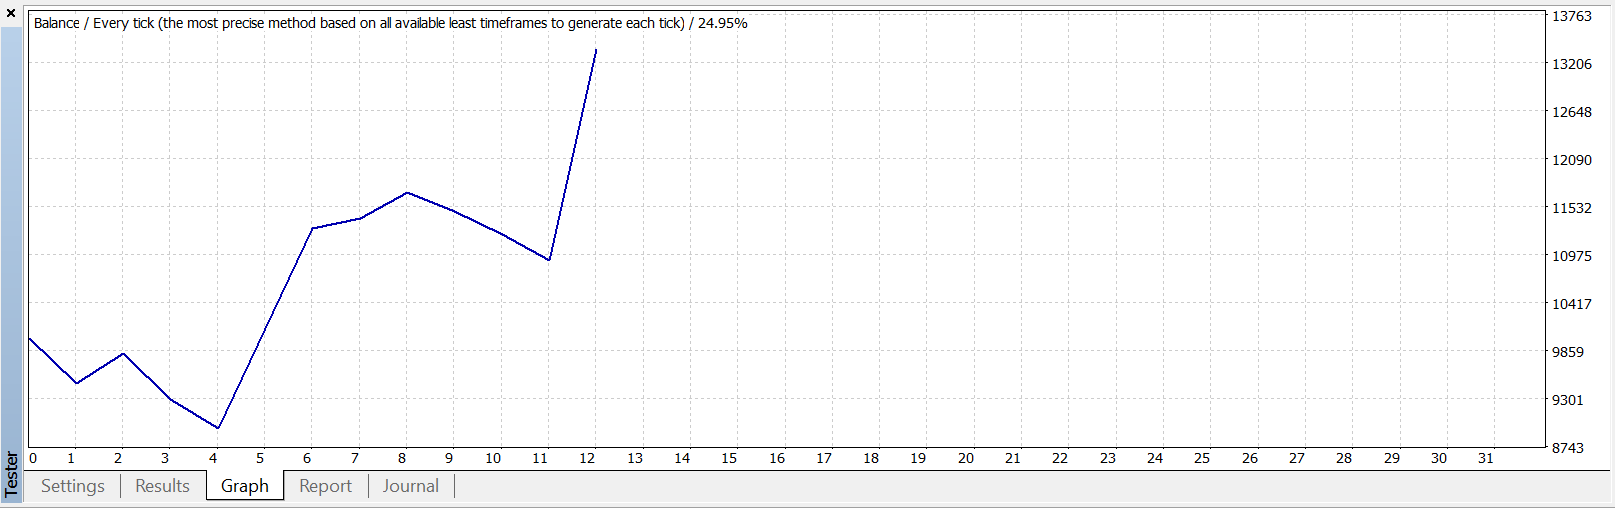
Graph: This tab contains all the performed trades visualized by a Profit Curve. The horizontal axis represents the number of trades the vertical represents the account balance. I assume that you will have limited available historical data, so a similar Profit Curve to the one below will appear (if you are lucky as I am and the test ended in profit 🙂 ).
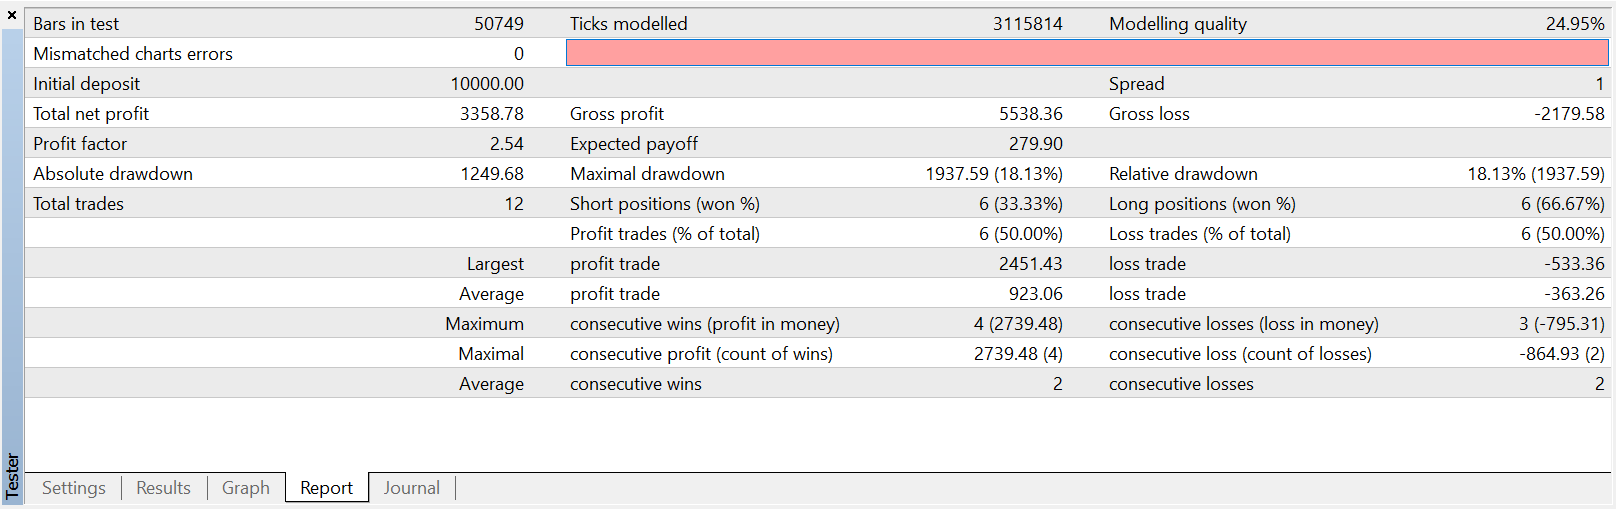
Report: Here are some useful stats that will help you quickly evaluate the performance of the strategy. I always look at the Total Net Profit, Drawdown (Maximal and Relative), and Profit Factor. These values can give you a fast preview of the strategy efficiency.
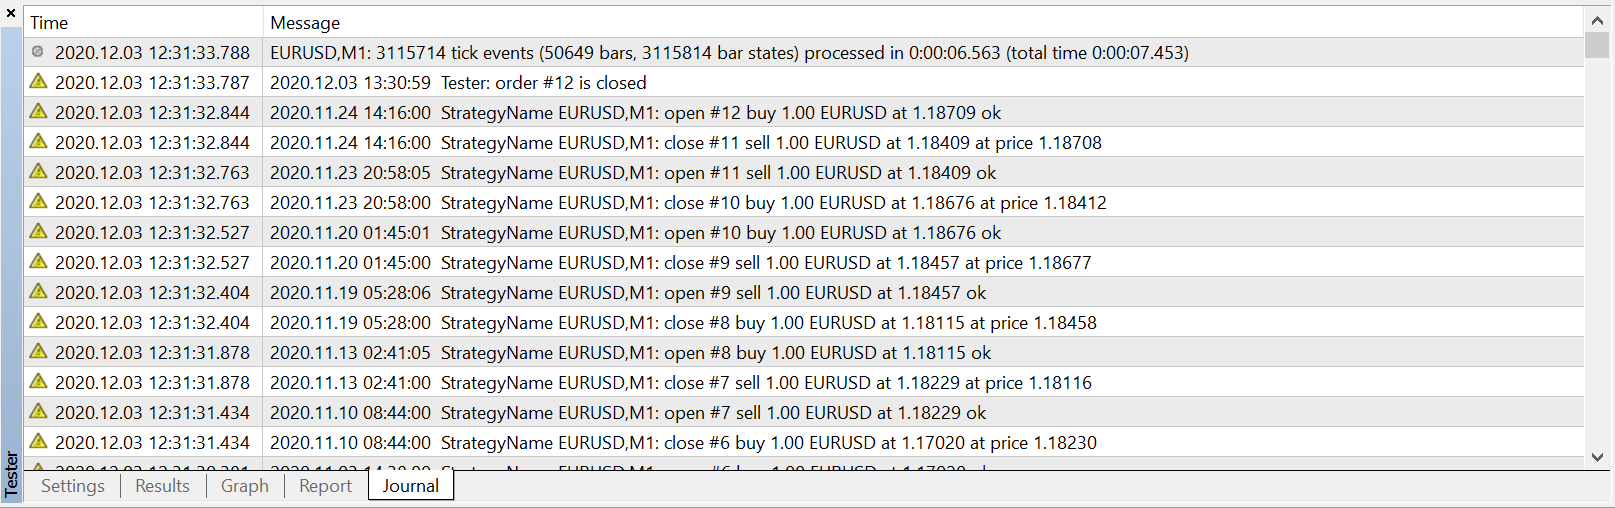
Journal: This tab will be useful for all the developers when testing and debugging some new features. You can see the Strategy Tester log of all the events, errors, or your custom logs.
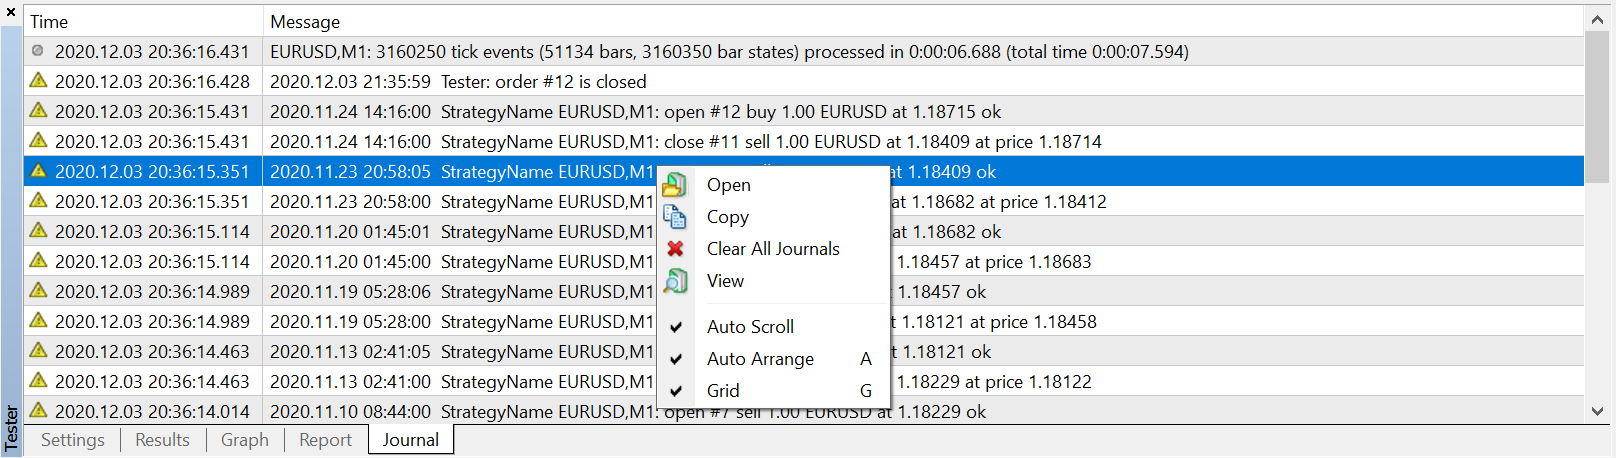
By right-clicking anywhere in the log, you can open the log file in text format. By selecting “View,” you can search through the log using some basic filters.
The backtesting topic will surely be covered in multiple more detailed posts. Still, I hope you got a basic understanding of how to operate the strategy tester and evaluate your strategies. If you have any questions or feedback, do not hesitate to reach to me in the comments.
Still, have no trading account yet? Open an account at one of my trusted brokers suitable for algorithmic trading completely for free and start testing today!
This post contains affiliate links. If you use these links to register at one of the trusted brokers, I may earn a commission. This helps me to create more free content for you. Thanks!

